
You're looking at steady traffic, a polished homepage, and fewer completed purchases than the business needs. The obvious reaction is to rewrite the hero section, change the button, or commission a complete redesign.
That reaction can waste weeks. I'm Samuel Woods, a Fractional Chief AI Officer working with machine learning since 2016 and generative AI since 2019. I've helped founders, owner-operators, and small teams apply prompt engineering, context engineering, AI agents, and automation to revenue problems. My view is direct: conversion improvement starts with diagnosis and disciplined experiments, and a pile of page tweaks won't replace them.
The practical question is where your funnel is losing valuable users, why they're leaving, and which intervention deserves engineering, marketing, or product time.
Table of Contents
- Why Conversion Improvement Starts With a Diagnosis
- Map the Funnel and Find the Real Bottleneck
- Prioritize CRO Opportunities by Expected Value
- Improve Landing Pages and High-Intent Funnels
- Use AI for Copy and Personalization
- Run Reliable Conversion Experiments
- Put the CRO Playbook Into Practice
Why Conversion Improvement Starts With a Diagnosis
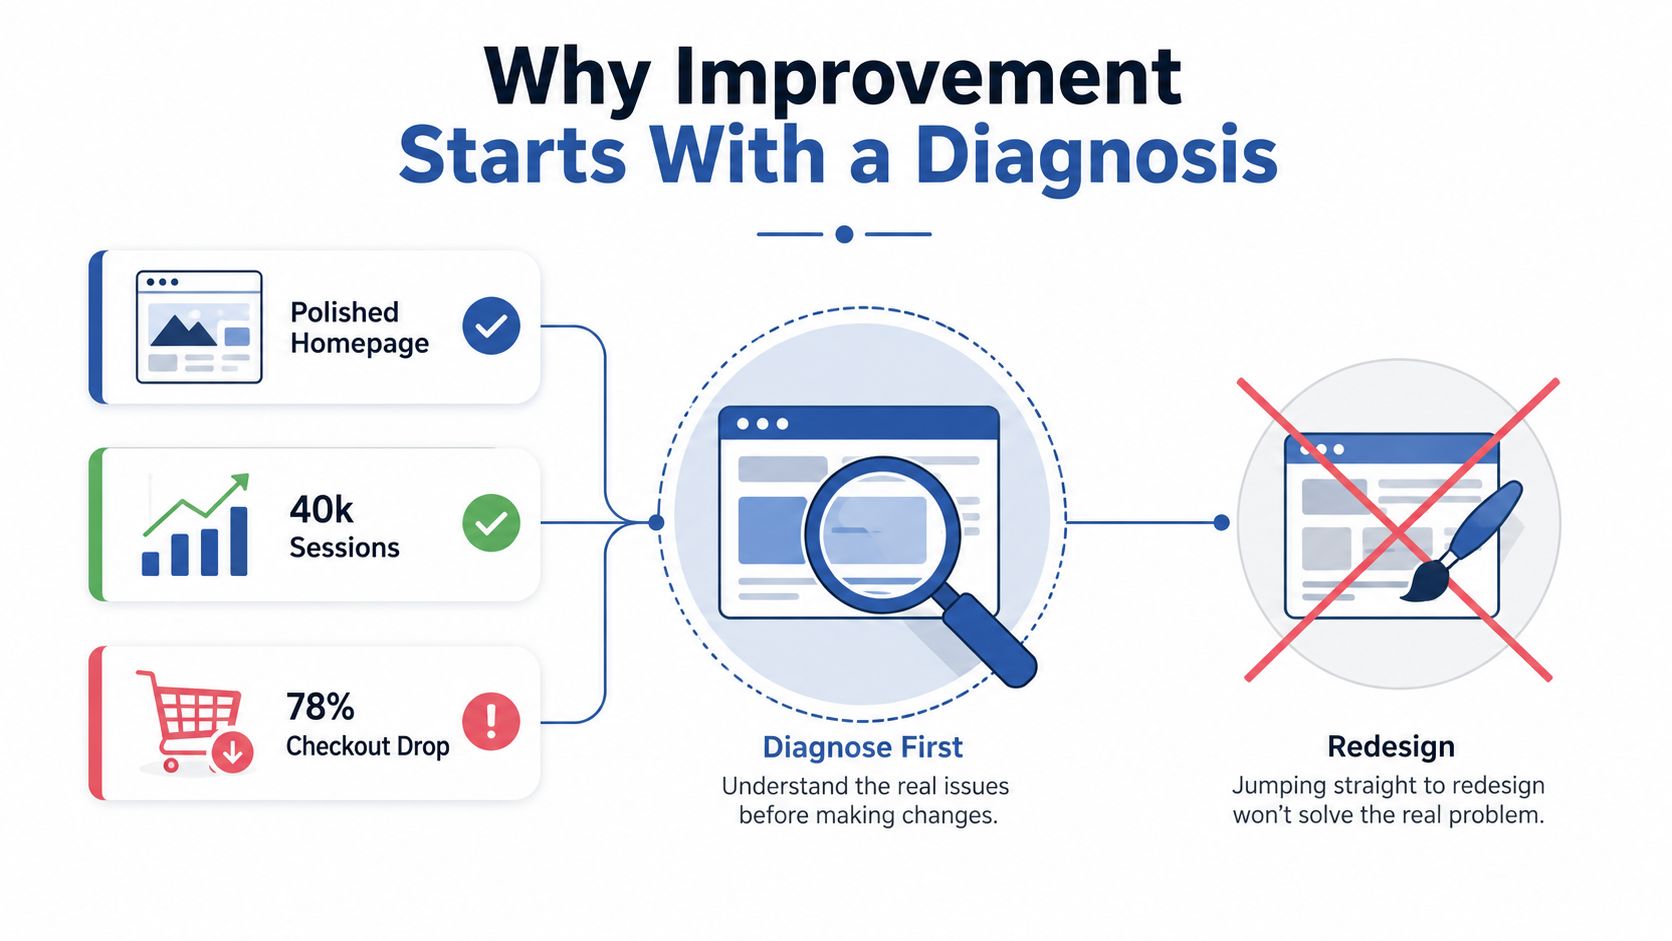
A founder sees 40,000 monthly sessions, a homepage that looks professional, and a checkout where 78% of users drop out. The reflex is to redesign the landing page.
I'd stop that project.
The homepage may be doing its job. The acquisition campaign may be attracting the wrong audience. A payment error, unexpected fee, forced account creation, or broken mobile field may be blocking buyers after intent has already formed. A redesign before investigation turns uncertainty into expensive opinion.
Define the business event first
Conversion means different things in different models. For ecommerce, it may be a completed purchase. For SaaS, it might be an activated account, a qualified demo request, or a paid upgrade. For a professional service, a lead form can be a useful early event, but revenue quality still matters later.
Write down four answers before editing a page:
- Which primary event creates measurable business value?
- What is a completed conversion worth after costs, refunds, support, and fulfilment?
- Which step loses the most valuable users?
- Which analytics, recordings, support notes, or customer conversations support that conclusion?
A page-level conversion rate can look healthy while downstream activation or retention disappoints. Conversely, a modest landing-page rate may be acceptable if the resulting leads close efficiently. Optimizing the wrong event can lower acquisition cost on paper while reducing margin in practice.
Treat redesigns as hypotheses
Every page makes an assumption about an audience, a problem, and a next action. If you can't state that assumption clearly, the page is difficult to test.
A practical rule: don't approve a redesign until you can name the funnel step it should improve and the guardrail metric that prevents business damage.
The benchmark gap supports a focused approach. Independent summaries report a median landing-page conversion rate of 4.02% versus 2.35% for general website pages, while the top quartile exceeds 11.45% (Digital Applied landing-page benchmark summary). That evidence supports specialized pages and focused actions, but it doesn't tell you that your homepage is the bottleneck.
On Monday, pause broad creative work. Confirm the conversion event, validate tracking, and identify the most expensive leak. The first useful deliverable is a diagnosis, not a mockup.
Map the Funnel and Find the Real Bottleneck
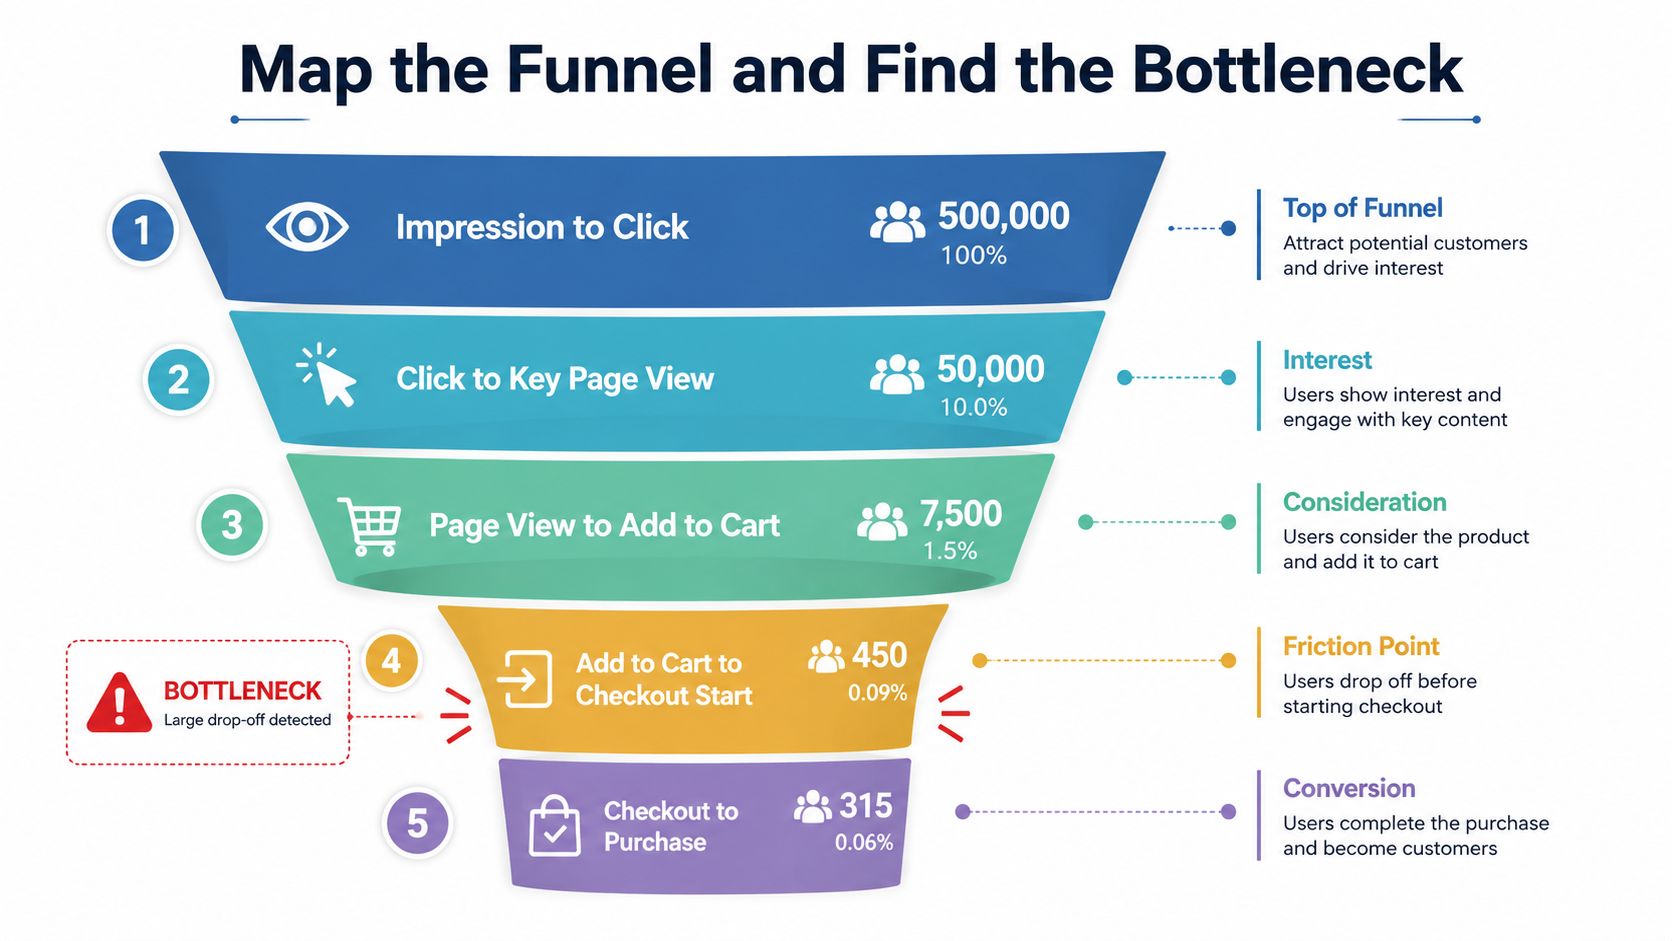
Start with a sequence that matches how a buyer moves.
- Impression to click
- Click to key page view
- Page view to add to cart or form start
- Add to cart or form start to checkout or submission
- Checkout or submission to purchase, activation, or qualified outcome
Record both the conversion rate at each step and the absolute number of users who remain. A final rate around 2.35% to 2.9% can hide a severe loss at one stage, while a high-volume step may deserve attention because it represents more revenue than a lower-volume page with a worse percentage.
Diagnose in the right order
First, define the event and confirm the instrumentation. Check whether duplicate events, missing mobile events, bot activity, consent states, or payment callbacks are distorting the numbers.
Next, segment the funnel. At minimum, compare:
- Acquisition source, split into email, paid search, organic, paid social, affiliates, and direct
- Device, across desktop, mobile, and tablet
- Audience status, meaning new versus returning users
- Location, by relevant geographies and markets
- Intent, across branded, category, product, comparison, and transactional visits
Traffic quality can outweigh small copy changes. Recent landing-page benchmarks report a global median of 2.35%, with email at 5.2%, paid search at 3.1%, organic at 2.4%, and social media at 1.2% (DollarPocket landing-page conversion benchmarks). Read those figures as a warning against comparing channels as if users arrive with identical intent, rather than as targets for every business.
A SaaS page aimed at existing users should be judged differently from a prospecting page. An event page and a product-led software page also have different category expectations. One benchmark reports 12.3% median conversion for events and entertainment pages versus 3.8% for SaaS pages (involve.me landing-page statistics).
Add customer evidence
Analytics tells you where users stop. It rarely tells you the complete reason.
Review session replays, heatmaps, exit surveys, support tickets, sales-call notes, product reviews, and failed payment records. Search for repeated objections. “I don't understand what happens next,” “I can't find shipping costs,” and “I need approval from finance” require different solutions.
Cross-check behavioural evidence against revenue. The largest visual drop isn't automatically the highest-value opportunity. Weight the loss by conversion value, margin, retention, and support cost.
For onboarding work, streamline onboarding for SMBs offers useful context on reducing confusion after signup. That matters because a lead or registration only helps when the next step is clear enough to produce activation.
Use conversion funnel analysis to document each transition, segment, event definition, and suspected cause. Keep the output operational: one bottleneck, one evidence-backed hypothesis, and one owner.
Prioritize CRO Opportunities by Expected Value
Once you've identified the bottleneck, resist the pet idea. The most persuasive idea in the room may still be weaker than a less exciting fix to payment errors, form friction, or traffic-message mismatch.
Build an opportunity portfolio with 15 to 25 ideas. Include page changes, campaign changes, product changes, checkout fixes, instrumentation work, and customer-support interventions. Then score every idea against the same criteria.
Use a simple scoring model
A useful expected-value model is:
Expected value = expected lift × value per conversion × confidence, minus implementation cost and downside exposure.
“Expected lift” refers to the primary metric, not a vague feeling that the page will look better. “Confidence” reflects the strength of evidence behind the hypothesis. “Downside exposure” includes margin loss, refund risk, retention damage, brand risk, legal concerns, and operational load.
A discount test may increase completed orders while reducing contribution margin. A shorter form may raise lead volume while lowering sales qualification. A personalized recommendation may increase clicks while pushing customers toward lower-margin products. Score those consequences before launch.
| Idea | Expected Lift (%) | Confidence (0-1) | Effort (days) | Risk Level |
|---|---|---|---|---|
| Remove optional form fields | [estimate] | [0-1] | [estimate] | Low, medium, or high |
| Add transparent checkout costs | [estimate] | [0-1] | [estimate] | Low, medium, or high |
| Change paid-social audience | [estimate] | [0-1] | [estimate] | Low, medium, or high |
| Test a new value proposition | [estimate] | [0-1] | [estimate] | Low, medium, or high |
| Add segment-specific copy | [estimate] | [0-1] | [estimate] | Low, medium, or high |
Keep estimates clearly labelled as estimates. Don't turn a planning assumption into a reported result.
Balance upside with reversibility
Rank the portfolio by value, confidence, effort, and risk. Ship quick wins when the evidence is strong and the change is reversible. Give deeper research to ideas with high potential but weak evidence. Separate tests that can run behind a feature flag from interventions that alter pricing, fulfilment, or customer expectations.
Published testing benchmarks report a median conversion uplift of 1.88% from winning variants, a 2.77% median revenue-per-visitor uplift, and statistically significant winners in about 36.3% of tests at 95% confidence (CartFlows A/B testing statistics). That's why your portfolio needs many credible bets. A single dramatic redesign is a fragile growth plan.
On Monday, score the ideas with the person who owns revenue and the person who owns implementation. If the list contains only copy changes, your diagnosis is probably too narrow.
Improve Landing Pages and High-Intent Funnels
Treat each landing page as a hypothesis about one audience and one intent. The page should answer the visitor's expected question quickly, then make the next action obvious.
A paid-search visitor who clicked “inventory management for Shopify” shouldn't arrive at a generic software homepage. The headline, proof, feature explanation, and CTA should continue the promise that earned the click. That continuity is message match, and it reduces the mental work required to decide whether the page is relevant.
Fix the page in a controlled sequence
Start above the fold:
- Write a headline that names the business outcome or problem solved.
- Use the subhead to qualify the promise with audience, mechanism, or use case.
- Make the primary CTA state the action and its immediate value.
- Place relevant proof near the decision point.
- Answer the objection most likely to block action.
Repeat the primary CTA at natural points, but don't create competing destinations. A demo page should guide the visitor toward requesting a demo. A lead magnet page should make the download the main action.
For forms, remove fields that don't affect qualification, fulfilment, or routing. Use smart defaults, browser autofill, inline validation, and progressive profiling where the business can collect additional information later. If sales needs company size, role, budget, and use case immediately, test the trade-off instead of assuming a short form always wins.
I've written a more detailed landing-page optimization best-practices guide if you need a page-level review.
Treat checkout as a revenue product
Baymard reports that the average large ecommerce site could gain a 35.26% conversion-rate increase from checkout design improvements alone, and its usability research has found checkout-flow design to be the sole cause of abandonment in testing (Baymard checkout usability research). That makes checkout a priority when purchase intent is already high.
Test guest checkout, address autocomplete, transparent fees, appropriate payment options, clear error messages, and trust information close to the submit button. Don't hide shipping or taxes until the final screen. A conversion lift that comes from surprising users late in the process will usually return as support tickets, refunds, or negative reviews.
Connect every change to a metric
| Element | Change | Typical Impact | Effort |
|---|---|---|---|
| Message match | Mirror the intent and promise from the acquisition source | More qualified page engagement | Low to medium |
| Form | Remove optional fields and improve validation | More completed submissions | Low to medium |
| Checkout | Add guest purchase and upfront cost clarity | Fewer last-mile exits | Medium |
| Page speed | Compress assets and remove unnecessary scripts | Better progression to the next step | Medium |
| CTA | State the action and expected outcome clearly | More qualified clicks | Low |
Speed deserves its own ticket. One cited dataset reports that landing pages loading in under 3 seconds convert 32% better than slower pages (Sellers Commerce landing-page statistics). Use your own analytics to confirm the relationship, then improve loading performance alongside conversion events rather than treating it as a separate technical project.
Use AI for Copy and Personalization
AI can help you produce and compare more relevant messages faster. It can also create false claims at production speed, so I don't let a model publish customer-facing copy without human review.
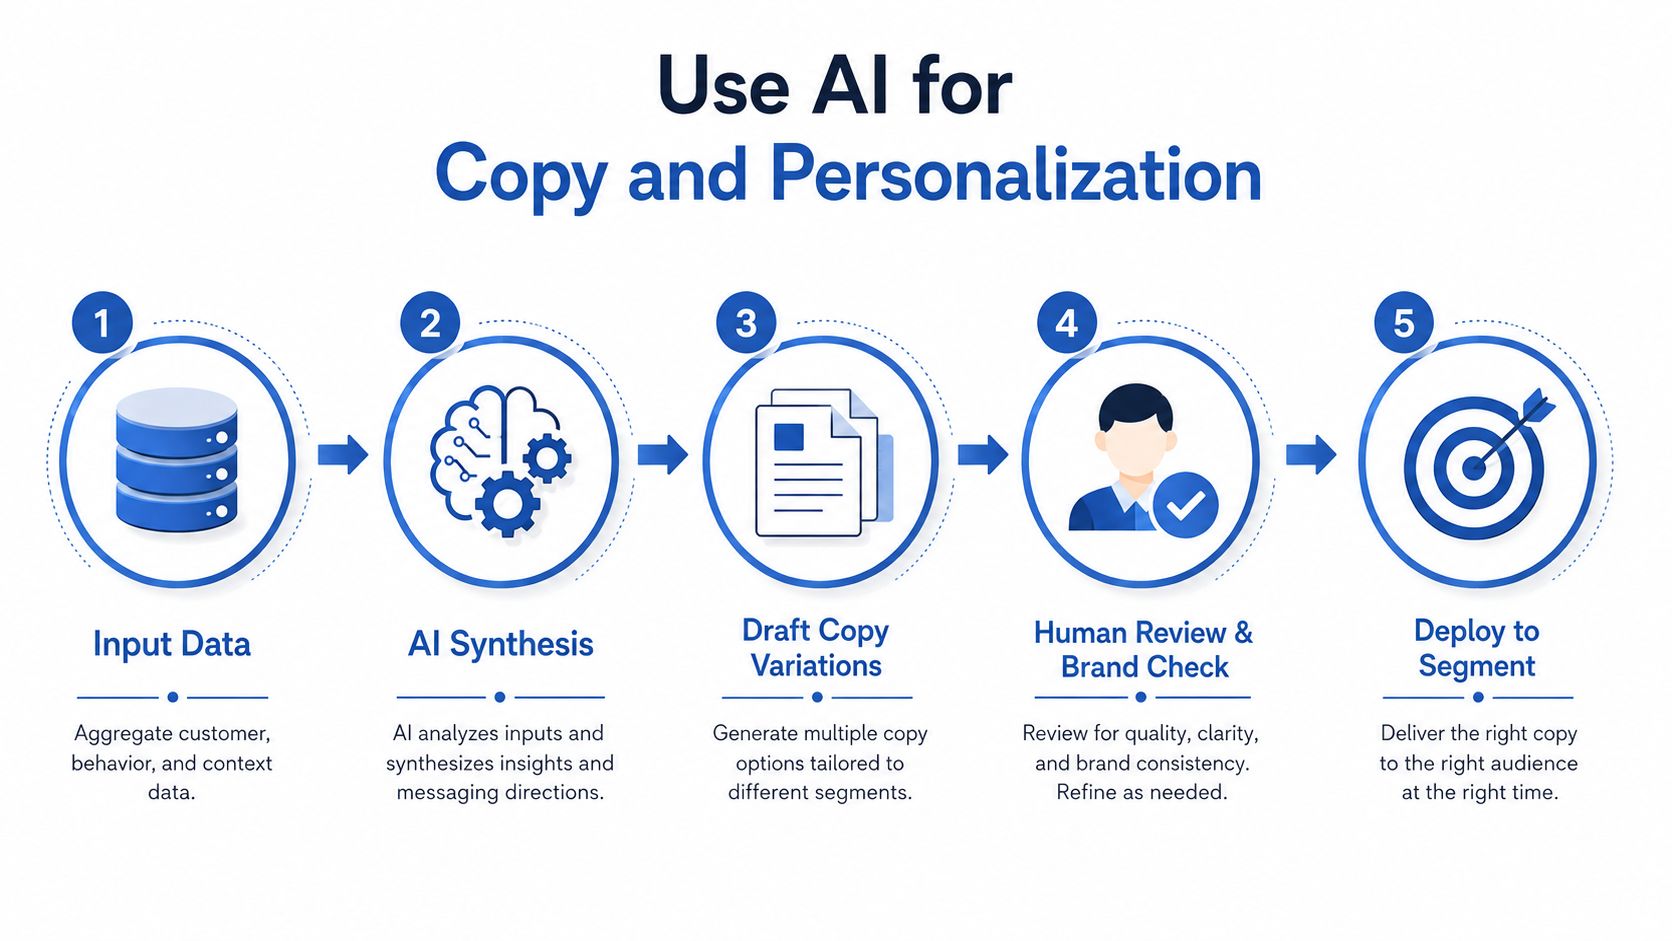
Consider a SaaS team with call notes, support tickets, reviews, and sales objections spread across different systems. An AI workflow can cluster that material into themes such as implementation anxiety, reporting gaps, security questions, or migration effort. A copywriter can then turn those themes into headline and subhead variants for the relevant audience.
The model organizes evidence you already own. It doesn't discover truth from nowhere.
Use AI where the workflow is bounded
For ecommerce, give the model structured product attributes, approved benefits, exclusions, and audience context. It can draft descriptions, propose objection responses, and adapt hero copy for first-time versus returning visitors. It must not invent materials, stock status, product features, delivery promises, or pricing.
Useful prompt patterns include:
- “Extract repeated objections from these anonymized call notes. Group by frequency and buying stage. Quote only text supplied in the notes.”
- “Write five headline variants for this audience and intent. Preserve these approved product claims. Mark any unsupported claim as [NEEDS REVIEW].”
- “Draft CTA variants that describe the next step without implying a guarantee.”
- “Create follow-up email options based on the user's stated objection. Don't add discounts, features, or deadlines.”
If you're exploring the topic, you can also review AI-driven conversion strategies for 2026, then test each proposed tactic against your own economics.
Put guardrails around personalization
Human reviewers should approve every shipped string. Verify factual claims, score brand voice, log the source context, and prevent the system from using sensitive data without consent. Keep personalization understandable. If a visitor feels watched rather than helped, relevance becomes a trust problem.
My operating model is simple:
- AI drafts and clusters.
- Humans verify and edit.
- Analytics evaluates the business result.
Personalization should earn its place through conversion quality, margin, retention, and customer feedback. If it adds engineering complexity without improving a meaningful metric, stop using it.
Run Reliable Conversion Experiments
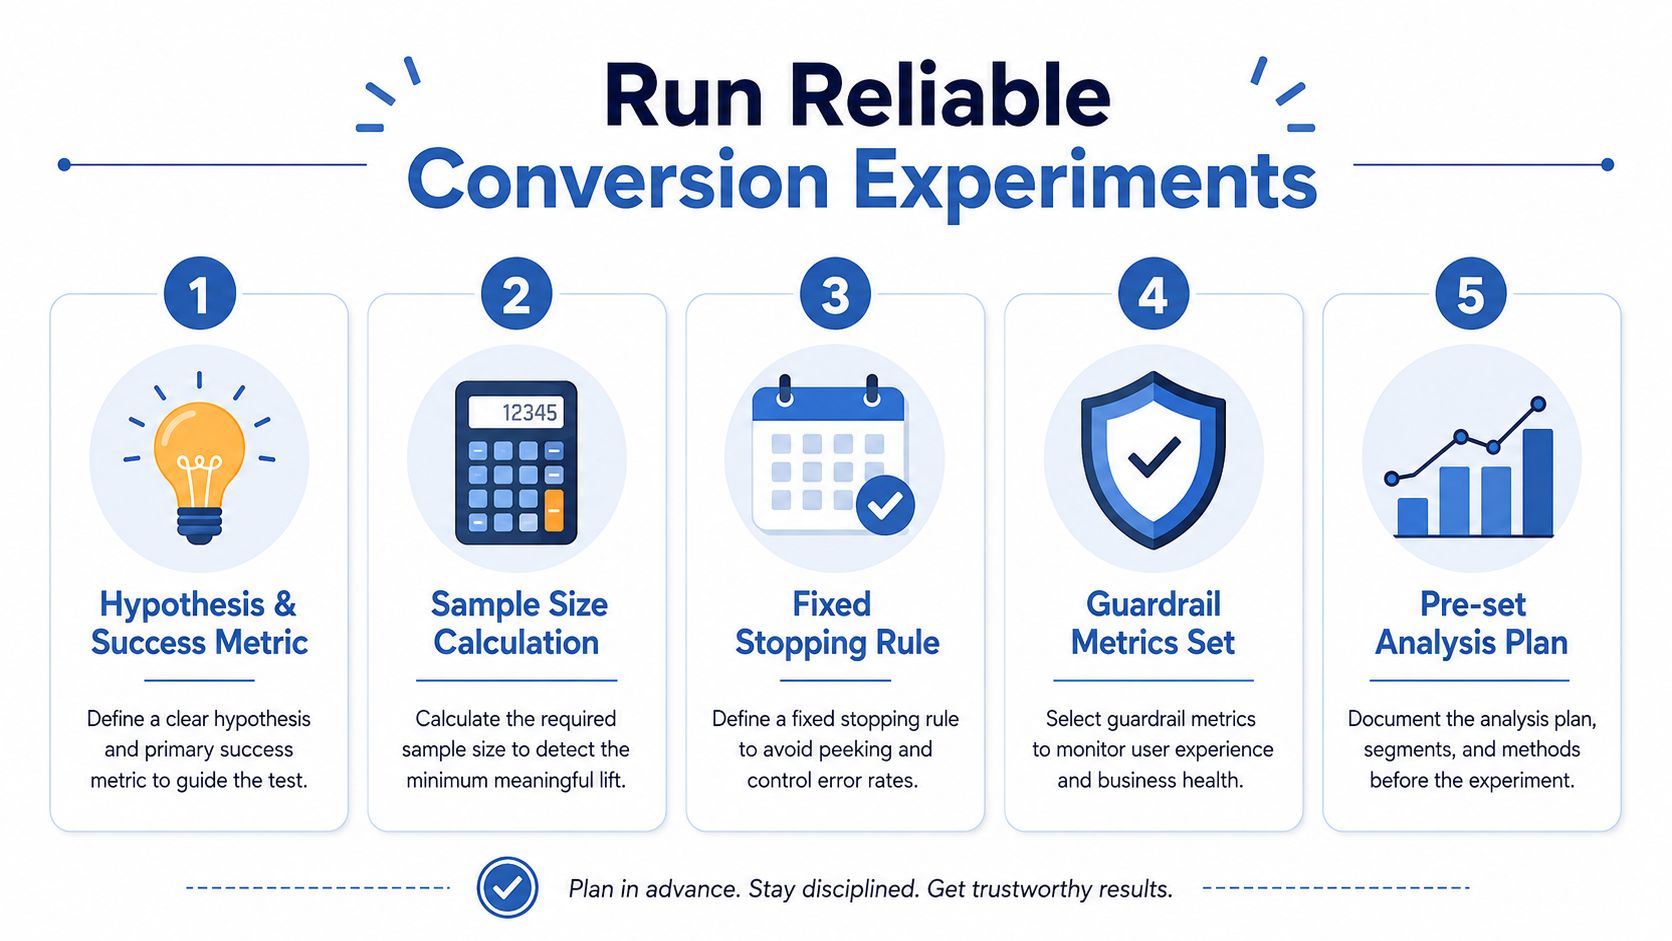
A test is a decision system, which takes more than a coloured button with a dashboard attached. Before launch, write the hypothesis in a form that another person can challenge:
For [audience] arriving with [intent], changing [specific element] will improve [primary metric] because [evidence-backed reason], without harming [guardrail metrics].
Choose one primary conversion metric. Define the minimum detectable effect, baseline rate, desired power, traffic allocation, test horizon, and analysis method before users enter the experiment. Your sample-size calculation should use the baseline conversion rate, the minimum effect worth detecting, and the desired statistical power.
Protect the experiment from bad inputs
Randomly assign eligible users and keep the allocation stable. Don't let one variant receive mostly branded search while the other receives mostly cold social traffic. Check device coverage, browsers, consent states, localization, payment methods, and event firing before launch.
Set guardrails that represent the business:
- Revenue, measured as revenue per visitor or qualified pipeline value
- Margin, meaning contribution margin after discounts and fulfilment
- Customer quality, seen in activation, retention, or sales acceptance
- Service load from refunds, cancellations, and support tickets
- Technical health, tracked through errors, latency, and failed payment events
A variant can increase form submissions while lowering sales acceptance. A checkout change can raise orders while increasing refunds. The primary metric cannot protect you from those outcomes by itself.
Use a fixed decision process
Set a fixed stopping point or a valid sequential-testing method. Early peeking makes random fluctuations look like evidence. Yet roughly 47.2% of CRO practitioners lacked a standard stopping point, according to an industry analysis of 28,304 experiments, which also reported that experiments with no wins reduced conversion by an average of 26% during the test period (Digital Applied conversion-rate benchmark analysis).
Another conversion research framework reports that about 85% of experiments may decrease conversion during the testing window when multiple variations are introduced (CBS Research conversion-rate optimization thesis). Treat that as a reason to limit concurrent changes, monitor guardrails, and avoid declaring failure or success from a noisy early window.
My decision rule: ship when the primary metric clears the pre-set threshold and guardrails hold. Iterate when the direction is useful but the effect is unclear. Kill when the evidence is weak or the downside is real. Roll back when revenue, margin, retention, or customer experience deteriorates.
Analyse segments after the main result, but don't hunt until one subgroup produces a convenient story. Segment findings create follow-up hypotheses. They rarely justify immediate full rollout without revalidation, particularly when pricing, offers, or onboarding behaviour changes.
Use this conversion-rate optimization checklist before launch. It gives you one shared QA reference instead of relying on memory during release week.
Put the CRO Playbook Into Practice
On Monday, turn conversion improvement into a weekly operating rhythm. Give the work a named owner, a primary metric, a decision date, and a direct connection to revenue or cost.
Monday diagnosis
Pull the funnel by source, device, audience, and intent. Confirm event quality before interpreting the result. Interview customers or review support conversations that match the failing step, then write one evidence-backed hypothesis.
Tuesday prioritization
Score the opportunity against expected lift, confidence, implementation effort, and risk to margin, retention, brand, and compliance. Choose one or two opportunities, not an ambitious backlog disguised as focus.
Wednesday experiment design
Record the hypothesis, primary metric, minimum detectable effect, sample size, confidence threshold, expected lift, test horizon, and guardrails. A pre-launch QA pass should confirm traffic allocation, event tracking, device coverage, browser behaviour, consent handling, and seasonality checks.
Thursday launch
Release the smallest change that can answer the question. Keep the control stable, monitor errors and guardrails, and avoid changing campaign targeting or pricing during the test unless that interaction is part of the design.
Friday review
Don't stop because the chart looks exciting. Review the pre-set stopping rule, primary result, guardrails, segment patterns, and business-quality measures. Record the decision as ship, iterate, kill, or park.
A reusable scorecard can look like this:
| Field | Decision |
|---|---|
| Hypothesis | Audience, change, reason, expected outcome |
| Primary metric | One business event |
| Minimum detectable effect | Smallest worthwhile change |
| Sample size | Required traffic before analysis |
| Confidence threshold | Pre-set statistical standard |
| Expected lift | Planning estimate, clearly labelled |
| Risk | Margin, retention, compliance, support, or brand exposure |
For the first 30 days, fix measurement gaps and high-confidence friction. During the next 60 days, address structural funnel and checkout problems. By 90 days, introduce AI-assisted research, copy variation, and controlled personalization where the data and consent model support it.
For additional practical perspectives, I recommend the Sprints & Sneakers growth insights. Use outside advice to generate hypotheses, then let your funnel evidence decide what ships.
The durable advantage is operational: every week, you know which leak matters, which test can answer it, and what business damage must be avoided.
If your funnel has steady traffic but weak completions, start this Monday by defining the conversion event, segmenting the drop-off, and reviewing the last step before purchase or submission. Then build the scorecard, assign an owner, and launch one controlled experiment tied to revenue, margin, acquisition cost, retention, or time saved.