
Most advice on churn is backwards.
Companies obsess over a dashboard number they can't change because it describes damage that already happened. By the time your monthly churn report lands in a leadership meeting, your competitor has already won those customers, your revenue forecast is already weaker, and your team is already reacting late.
I'm Samuel Woods, and I've been building ML systems since 2016. The businesses that get this right don't treat churn as reporting. They treat it as an early-warning and response system. That's the effective playbook for how to predict customer churn in a way that protects revenue and gives you speed your competitors don't have.
Stop Tracking Churn and Start Preventing It
If your churn process starts with a dashboard, you're already behind.
A churn rate is useful for finance. It's useful for board reporting. It's useful for seeing whether the business got healthier or weaker. But it's a terrible operating model if your goal is to keep customers. Reporting tells you what happened. Prediction tells you who needs attention before the account is gone.

The right framing is simple. Churn is a ranked list of customers who need intervention now.
A foundational approach is to model churn as a binary classification problem using historical labeled data, with signals like purchase recency, CSAT, interaction frequency, billing events, feature usage, and support tickets. The output isn't just churn or no churn. It's a risk score you can use to prioritize action. IBM's guidance also notes churn can be handled as a time-to-event problem when you want to estimate when a customer is likely to leave, not just whether they will. That framing matters because churn is usually measured over a period such as 5% per month or 24% per year. That makes it a time-bounded business problem, not a vague intuition (InMoment on customer churn prediction).
What a real churn win looks like
Many organizations define success badly. They say they want “better retention insights.” That's too soft. You want something harder:
- Save high-risk revenue: Focus on accounts with meaningful expansion or renewal value.
- Protect product adoption: Catch behavior decay before the customer mentally checks out.
- Respond faster than competitors: Act while the customer is still deciding, not after cancellation.
- Turn churn into product intelligence: Every pattern tells you where your experience breaks.
If you need tactical retention ideas alongside prediction, this guide on reducing customer churn for SaaS is worth reading because it complements the modeling side with practical intervention thinking.
Practical rule: Don't build a churn model until you know what action your team will take for high-risk customers, medium-risk customers, and false positives.
Why speed beats perfect analysis
You do not need the fanciest stack on day one. You need a system that identifies risk and routes it to action.
That usually means your data, CRM, support system, and product telemetry need to feed one operational workflow. If your current tools are fragmented, fix that first with a cleaner automation layer and a better orchestration setup. I've written about that in this breakdown of AI workflow automation tools.
The businesses that win here don't just understand churn better. They move faster on it. That's the advantage.
The Data and Features That Actually Predict Churn
Shallow churn data gives you shallow decisions.
If your model only watches login gaps, ticket spikes, and failed payments, you are building the same view every competent SaaS operator can build. That does not create advantage. It creates a late warning system.
You need a dataset that captures behavior change, experience quality, and friction early enough to intervene before a competitor does.

Start with the standard signals
Use the basics first. They still matter because they give your model commercial context and operational grounding.
- Commercial activity: Purchase recency, billing events, plan changes, renewal timing.
- Engagement behavior: Interaction frequency, core feature usage, drop-offs in activity.
- Customer health indicators: CSAT trends, support tickets, unresolved issues.
- Account context: Segment, contract type, tenure, internal ownership.
These inputs are useful because they are usually available, reasonably clean, and easy for customer success, product, and finance teams to interpret.
Add signals that many data-driven teams overlook
The bigger edge comes from behavioral friction inside the product.
FullStory argues that a lot of churn prediction work still centers on CRM fields and high-level usage metrics while missing in-product struggle signals such as rage clicks, failed forms, incomplete onboarding flows, and repeated errors (FullStory on predicting customer churn). Those events matter because churn often starts long before a cancellation request or renewal conversation. The strongest systems identify who is at risk and where the customer experience is breaking.
That is where churn prediction becomes an offensive tool. You are no longer just scoring account risk. You are finding weak points in the product, fixing them faster, and keeping competitors out of the evaluation window.
If a customer keeps failing in onboarding, the retention issue is only part of the problem. You are also looking at lower activation, more support cost, weaker expansion odds, and poorer referral potential.
Engineer features that capture change
Raw fields are not enough. You need features that show direction, velocity, and disruption.
A customer who used a feature ten times this week may be healthy or drifting. The difference depends on their prior pattern, account type, onboarding stage, and recent experience. Churn models improve when you feed them movement instead of static snapshots.
A practical feature framework:
| Feature type | What it captures | Why it matters |
|---|---|---|
| Trend features | Rising or falling usage over time | Detects gradual disengagement |
| Recency features | Time since purchase, login, support contact | Flags inactivity and cooling intent |
| Frequency features | Number of sessions, tickets, billing events | Surfaces repeated patterns |
| Friction features | Errors, failed forms, incomplete flows | Exposes product experience breakdown |
| Relationship features | CSAT, support interactions, account touchpoints | Reflects service and trust quality |
Cross-functional measurement discipline matters here. If marketing promises one customer outcome, sales closes a different use case, and product tracks neither cleanly, your model will miss the underlying cause of churn. Fix the measurement chain first. This guide on measuring marketing effectiveness across the funnel is relevant because churn risk often starts upstream with poor-fit acquisition, weak onboarding expectations, and bad campaign-to-product alignment.
Fewer features beat noisy feature sprawl
You do not need a giant feature warehouse. You need a smaller set of variables that are clean, stable, and tied to customer behavior.
In a bank churn machine learning workflow, phData describes building a labeled classification dataset, encoding categorical fields, reducing a large pool of candidate attributes through cross-validation, and scoring customers on a recurring schedule to keep the system usable over time (phData bank churn workflow).
That is the right lesson. Better feature selection beats data hoarding. A tight signal set that helps your team act this week is worth more than a bloated model nobody trusts.
Choosing Your Churn Prediction Model
The wrong model choice slows your response time and hands your competitors an opening.
Your goal is not to win a modeling contest. Your goal is to spot vulnerable accounts early, trigger the right intervention, and keep revenue in motion. Choose the model your team can run every week, wire into workflows, and improve without drama.
There are three practical options.
Option one uses heuristics
Rules-based churn detection is the fastest way to get coverage.
If a customer stops using a core feature, hits repeated support issues, or runs into a billing failure, route that account into an intervention workflow immediately. This method is blunt. It is also transparent, cheap to deploy, and useful for capturing obvious risk before it turns into lost revenue.
Use heuristics when:
- Your data is fragmented: You cannot train a reliable model yet.
- Your team needs clarity first: Sales and customer success can see why an account was flagged.
- You need speed: You want intervention this month, not a long model build.
Do not stop here. Heuristics catch visible decline. They miss weaker signals, variable interactions, and the early behavior shifts that let you beat competitors to the save.
Option two uses binary classification
This is the default choice for most companies, and for good reason.
A binary classifier predicts churn or not churn from historical labeled examples. In practice, every customer gets a risk score. That lets you rank accounts, set action thresholds, and assign different retention plays based on urgency, account value, or expansion potential.
For teams serious about turning churn prediction into a competitive weapon, this is usually the best place to start. It scales. It fits operational teams. It gives your business a repeatable way to act faster than a rival who is still reviewing dashboards after the damage is done.
Here's the rough shape in Python:
from xgboost import XGBClassifier
from sklearn.model_selection import train_test_split

X_train, X_test, y_train, y_test = train_test_split(X, y, test_size=0.2, random_state=42)

model = XGBClassifier()
model.fit(X_train, y_train)

risk_scores = model.predict_proba(X_test)[:, 1]
The code is the easy part. The actual work is choosing labels that match your business, setting thresholds your team can act on, and connecting those scores to a live retention motion.
A recent study showed what a high-performance churn-prediction pipeline looks like. It combined feature engineering, class-imbalance handling, SMOTE oversampling, probability calibration, and threshold optimization across seven models. The best performer was XGBoost with AUC-ROC 0.932, followed by LightGBM 0.930 and Gradient Boosting 0.926 (study on high-performance churn-prediction pipelines).
That matches what works in the field. Tree-based boosting models often give you the best balance of prediction quality, implementation speed, and operational fit.
Option three uses time-to-event modeling
Sometimes risk is not enough. Timing decides whether you save the account.
A time-to-event or survival analysis model estimates when churn is likely to happen. That matters in businesses with renewals, contract milestones, onboarding checkpoints, or usage patterns where the intervention window is short and valuable.
Here's the trade-off:
| Model approach | Best for | Main limitation |
|---|---|---|
| Heuristics | Fast deployment, clear triggers | Weak nuance |
| Binary classification | Broad operational scoring | Doesn't directly estimate timing |
| Time-to-event | Renewal timing and intervention planning | More complexity and stronger data requirements |
Build the simplest model your team will use. Improve precision after the workflow proves it can save accounts. Do not build a complex artifact that dies in a dashboard.
Early-stage companies should start with heuristics plus a basic classifier. Companies with clean history, predictable renewal cycles, and a retention team ready to intervene should add survival analysis once the scoring system is already driving action.
Making Your Model Trustworthy and Actionable
A churn model that nobody trusts is dead weight.
I've seen teams celebrate model performance while customer success ignores the output because they can't tell why an account was flagged. That's not a machine learning problem. That's an adoption failure. If your frontline team doesn't trust the prediction, no intervention happens and no revenue gets protected.
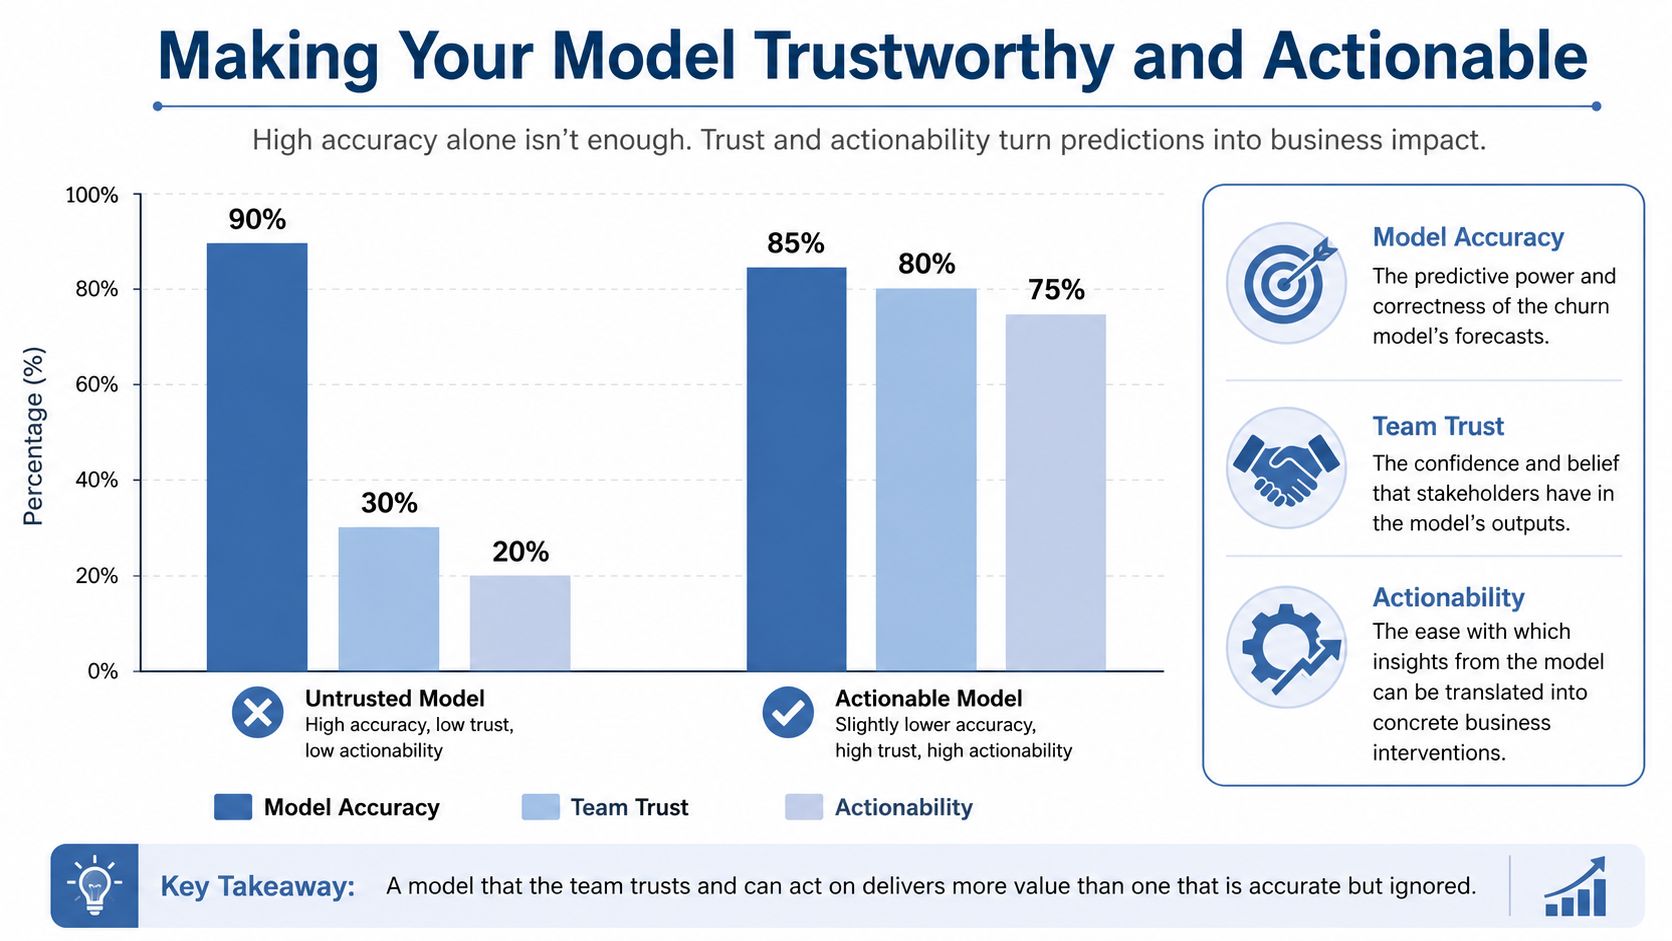
Accuracy is only part of the job
Yes, you should evaluate the model properly.
A large churn-prediction study in home rental care trained and tested on data from about 84,000 customers, then validated inference against about 250,000 live customer accounts. It reported about 90% performance using F-measure and AUC, and over 4 months achieved an about 80% hit rate in identifying actual contract status changes. The same work used permutation analysis to reduce the feature set to 53 features, with top drivers including commitment max sequences, rental model category, usage days, call count, and call type 004 (large-scale explainable churn study).
Those numbers are useful, but the bigger lesson isn't just performance. It's that explainability made the model operational.
What your team needs to see
Your customer success manager does not need a lecture on gradient boosting.
They need a screen that says this account is high risk because support interactions increased, usage days changed, and a commitment pattern shifted. If you use SHAP or another explainability layer, translate that output into plain business language.
A good churn interface answers three questions:
- How risky is this customer right now
- Why did the score move
- What should we do next
If your model can't answer all three, it's incomplete.
Field test: Put five flagged accounts in front of your CS team. If they can't explain the score and choose an action in a few minutes, your system isn't ready.
Trust grows when actions are specific
Many teams sabotage themselves. They deliver risk scores with no intervention map.
Different drivers should trigger different responses:
- Onboarding friction: Route to product education or human onboarding support.
- Billing issues: Trigger dunning, payment recovery, or account outreach.
- Feature abandonment: Send relevant enablement content or schedule a usage review.
- Support pain: Escalate to a senior rep and close the loop fast.
That is what makes a model actionable. Not the score itself. The score plus a reason plus a playbook.
You're not trying to impress your data science team. You're trying to give sales, CS, support, and product one shared operating picture of customer risk.
Deploying and Automating Your Churn Engine
A churn model sitting in a dashboard does not protect revenue. Speed does.
The companies that keep customers longer are not the ones with the prettiest reporting. They are the ones that score risk continuously, push the signal into live workflows, and act before a competitor gets a shot at the account. Deployment is where churn prediction stops being analysis and starts becoming a competitive weapon.
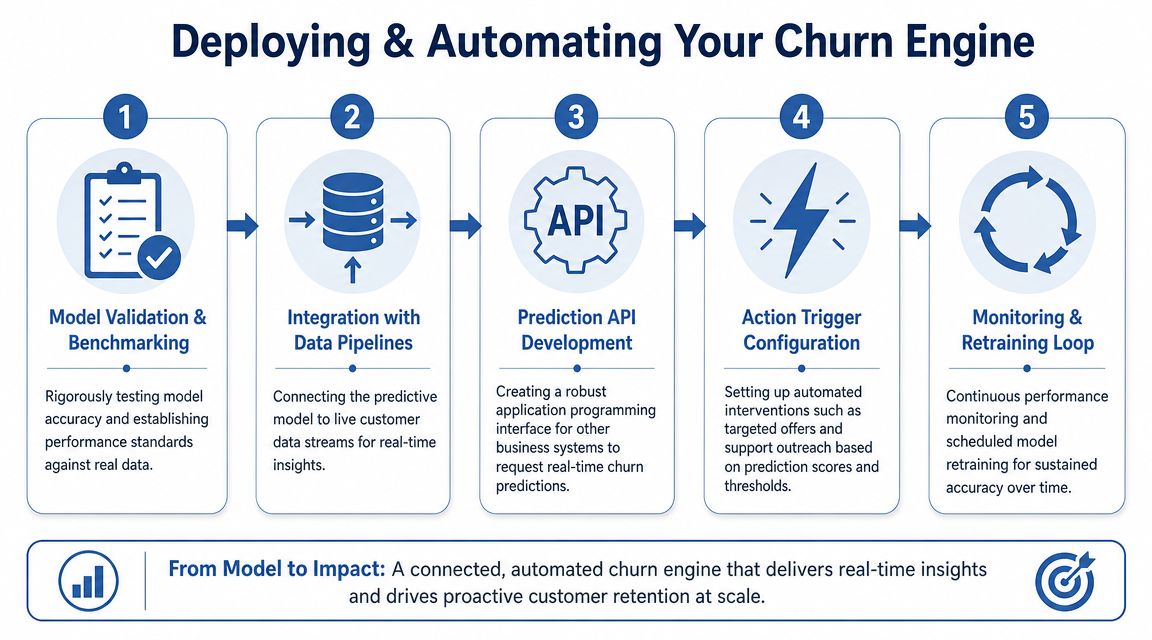
Build for operating speed, not model theater
Keep the production design simple. A strong churn engine pulls fresh product, CRM, billing, and support data into one pipeline, scores accounts on a schedule or key event, writes the result back into the systems your teams already use, and tracks whether the intervention worked.
That operating model wins because it is maintainable. Your team can debug it, trust it, and improve it without rebuilding the whole stack every quarter.
Here is the deployment stack that matters:
| Layer | What it does | What to avoid |
|---|---|---|
| Data pipeline | Joins product, CRM, billing, and support signals into one usable record | CSV exports, spreadsheet merges, and stale snapshots |
| Scoring service | Scores every customer on a schedule or after meaningful account events | Running scores only when an analyst gets asked |
| Decision layer | Maps risk and likely cause to a specific retention playbook | Sending the same save email to every risky account |
| Execution layer | Creates tasks, messages, alerts, and CRM updates automatically | Leaving follow-up trapped in a dashboard |
| Monitoring loop | Tracks prediction quality, drift, intervention results, and retraining needs | Assuming last quarter's model still fits current behavior |
Add automation where response time matters
Once scoring is reliable, automate the first move.
A high-risk account crosses a threshold. The system checks the likely cause, assigns the right playbook, creates a task for the owner, drafts outreach, alerts the right team, and logs the outcome. That is how you beat slower competitors. They are still reviewing a report while your team is already in the account.
If you want a closer look at how AI agents can run cross-functional churn workflows, start there.
A practical flow looks like this:
- Score the account daily, weekly, or at moments that change retention odds, such as renewal windows, usage drops, or support escalations.
- Classify the risk driver so the system knows whether the problem is onboarding, billing, product adoption, support friction, or a contract signal.
- Assign the response based on account value, segment, and likely cause.
- Trigger execution in CRM, email, Slack, or support tools.
- Record the outcome so the model and playbooks improve from real saves, losses, downgrades, and false positives.
To see the automation mindset in action, watch this short walkthrough.
Automate decisions, not random activity
Bad automation burns trust fast.
If the account is slipping because adoption collapsed, a discount teaches the customer to wait for price pressure. If support failures are driving the risk, an educational email wastes time and makes your company look out of touch. Good churn automation routes each risk pattern to the narrowest useful action.
That is the standard. Your churn engine should spot risk, diagnose likely cause, trigger the next best move, and learn from the result. Anything less is reporting with extra steps.
Your New Competitive Moat
Most companies will keep treating churn like a postmortem.
They'll review last month's losses, argue about causes, and launch broad retention campaigns that waste time on the wrong customers. Meanwhile, a smaller group will build systems that identify risk earlier, diagnose the cause, and trigger action before the customer leaves. That second group will protect revenue more effectively and learn faster from every near-churn event.
That's the core purpose of learning how to predict customer churn.
You're not building a clever data science project. You're building a decision advantage. You see account deterioration sooner. You intervene with more precision. You feed product, support, and leadership better information than your competitors have. Over time, that becomes a moat because your company gets better at keeping the right customers and fixing the right problems.
Start with one segment. One product line. One renewal cohort. Pull the data together, define the churn label, select the features that matter, and connect the output to a response workflow your team will use.
The company that acts on churn signals first doesn't just save accounts. It learns faster than the company still staring at a dashboard.
If you want help designing that system, from prediction to automation to agent-driven execution, you can explore working with me through Samuel Woods.