
Understanding customer behavior means tracking the sequence of actions a buyer takes, such as pages viewed, price comparisons, shipping-cost views and checkout delays, and tying them to a user or session. You map that decision path, find where friction shows up as delay, exit, repetition or reversal, and trigger one timely action whose result you can measure this week.
Most customer-behavior advice starts in the wrong place. It tells you to define your ideal customer, increase loyalty, and watch an NPS dashboard. That sounds sensible until the same buyer compares prices in the morning, checks reviews at lunch, abandons checkout after seeing shipping costs, then returns at night because a friend shared the product.
Loyalty is an outcome of well-understood decisions, not the input you optimize against. Buyers switch motivations, channels, and levels of intent constantly. I'm Samuel Woods, and I build AI-powered workflows for online businesses that need to see those shifts while they can still act on them.
That matters more now because digital commerce has become an always-on decision environment. McKinsey reports that over 90% of consumers in China and the US and over 80% in Germany and the UK shopped at an online-only retailer in the previous month, while nearly 40% of consumers in Germany, the UK, and the US used grocery delivery in the previous week. (McKinsey's 2025 State of the Consumer report)
The practical opportunity is clear. Your clickstream, transactions, support tickets, and customer language already contain the path to better decisions. AI can find patterns in that path, but only a workflow can turn the pattern into an email, product change, or experiment this week.
Table of Contents
- Why Most Customer Behavior Models Miss the Point
- What Understanding Customer Behavior Means for Operators
- The Three Frameworks That Earn Their Keep
- An AI-Powered Workflow to Collect and Act on Behavior
- Three Growth Use Cases That Map Behavior to Revenue
- Your Measurement Plan and the Number That Matters
- Where This Work Breaks and the Advice You Should Ignore
- What to Build This Week
Why Most Customer Behavior Models Miss the Point
Most loyalty programs assume yesterday's purchase behavior explains tomorrow's decision. RFM charts sort customers by recency, frequency, and monetary value, while NPS dashboards compress sentiment into a score. Both can be useful reporting tools. Neither explains why a customer hesitated between two sessions.
A buyer researching price at 9am may be looking for reassurance at 9pm. The person who browsed a comparison page may later read three reviews, ask support about returns, and remove the product from their cart after shipping appears. A demographic persona turns that sequence into a label such as “value-conscious shopper” and loses the reason the purchase happened or failed.
The buying journey itself is increasingly research-heavy. A 2025 consumer-behavior compilation reports that 78% of consumers research online before a significant purchase, 67% compare prices on at least three websites, and 71% trust websites with detailed customer reviews more than those without. (Consumer behavior statistics)
The data shift exposed the weakness
The post-2022 collapse of third-party cookies forced many teams to rebuild identity around first-party events. That change exposed a problem that had been easy to ignore: demographic segments often looked precise in a presentation while saying little about the sequence that produced a conversion.
The useful unit is the decision path. Page depth, browsing order, product comparisons, price exposure, support contact, and checkout delay tell you what the customer is doing now. Historical attributes can add context, but they shouldn't lead the diagnosis.
Practical rule: If your segment name describes who someone is rather than what they recently did, it probably won't tell you what to send or change next.
Loyalty still matters, but it belongs later in the chain. First, understand the decisions that create value. Then measure whether those decisions repeat. A customer who returns because your product solved a real problem is more valuable than a customer who clicks a loyalty email but never reaches value.
What Understanding Customer Behavior Means for Operators
Customer behavior becomes useful when it performs three jobs: maps the decision path, exposes friction, and triggers a timely response. A report that stops at description belongs in research. An operating model connects observed actions to a decision your team can change this week.
Map the decision path
Record events in sequence and tie them to a user or session identifier. A B2B visitor might move from the pricing page to a case-study page, then to integrations, back to pricing, and finally to a demo booking. That sequence points to a buyer checking commercial fit and implementation risk before agreeing to a conversation.
A DTC shopper may view a product, add it to the cart, open shipping information, remove the item, and leave. The signal lives in the connection between the shipping view and the removal event, not in any demographic profile.
Research on the Online Shoppers Purchasing Intention dataset reported CatBoost at F1 = 0.93 and ROC AUC = 0.985, while XGBoost reached F1 = 0.92. (Machine-learning analysis of online shopping intention) For operators, the practical lesson is straightforward: session-level behavior can predict intent more effectively than demographic fields alone.
Find the friction
Friction shows up as delay, exit, repetition, or reversal. Track idle time at payment, error events, shipping-cost views, return-policy visits, support contacts before purchase, and repeated attempts at the same onboarding step. These events give product and growth teams specific places to investigate instead of broad complaints about conversion.
Checkout behavior offers testable hypotheses. The cited consumer-behavior compilation reports that 54% abandon carts when shipping costs are higher than expected, and 42% abandon checkout when it takes more than two minutes. (Consumer behavior statistics) Those figures cannot predict your customers precisely, but they can justify testing clearer shipping information, faster checkout, or earlier cost disclosure.
Time the next move
Behavioral insight loses value when the response arrives late. Someone who reaches payment and stops may need an abandoned-cart message now. A quarterly segment report cannot help unless it produces an action while intent remains active.
Set the operating layer around three questions:
- What happened: Identify the recent event sequence.
- Why it matters: Connect that sequence to a known friction or intent.
- What happens next: Trigger one action with a measurable outcome.
This workflow turns raw events into a shortlist of decisions. The model supports judgment by narrowing the next test, while the operator decides which response fits the customer's path and the business constraint.
The Three Frameworks That Earn Their Keep
I use three behavior frameworks, and I don't treat them as competing religions. Each answers a different question. The right choice depends on the decision you need to make this quarter, not on the framework attached to the consultant's slide deck.
Jobs To Be Done works best when motivation drives a considered purchase. Interviews can reveal why a SaaS buyer is replacing a tool, what caused the switch, and which outcome matters in the buyer's own language. JTBD is weaker for real-time activation because an interview explains motivation without automatically detecting the next session's intent.
Behavioral cohorts group people by observed action. A cohort of users who visited pricing twice, opened an integration page, and returned within a short period can feed a lifecycle campaign directly. This method needs clean event definitions, but it supports weekly iteration.
Funnel-plus-retention models provide the operating backbone. They show where conversion leaks and whether onboarding changes produce repeat usage. A funnel without retention can reward one-time conversions. Retention without a funnel can hide the first point where users failed to reach value.
Three behavior frameworks compared
| Framework | Best Stage | Data Required | Activation Speed | Weakness |
|---|---|---|---|---|
| Jobs To Be Done | Pre-product-market fit or long buying cycles | Interviews, call notes, open-ended feedback | Slow | Weak real-time activation |
| Behavioral cohorts | Growth with reliable instrumentation | Event logs, transactions, campaign events | Fast | Depends on clean tracking |
| Funnel-plus-retention | Any stage with measurable conversion | Funnel events, cohort dates, usage or purchase data | Medium | Can miss underlying motivation |
My decision rule is simple. If you still don't know why people buy, start with JTBD interviews layered onto funnel data. If your instrumentation is reliable and you need weekly experiments, use behavioral cohorts. If you're scaling tests and need to know whether changes compound, stitch all three together.
An AI-Powered Workflow to Collect and Act on Behavior
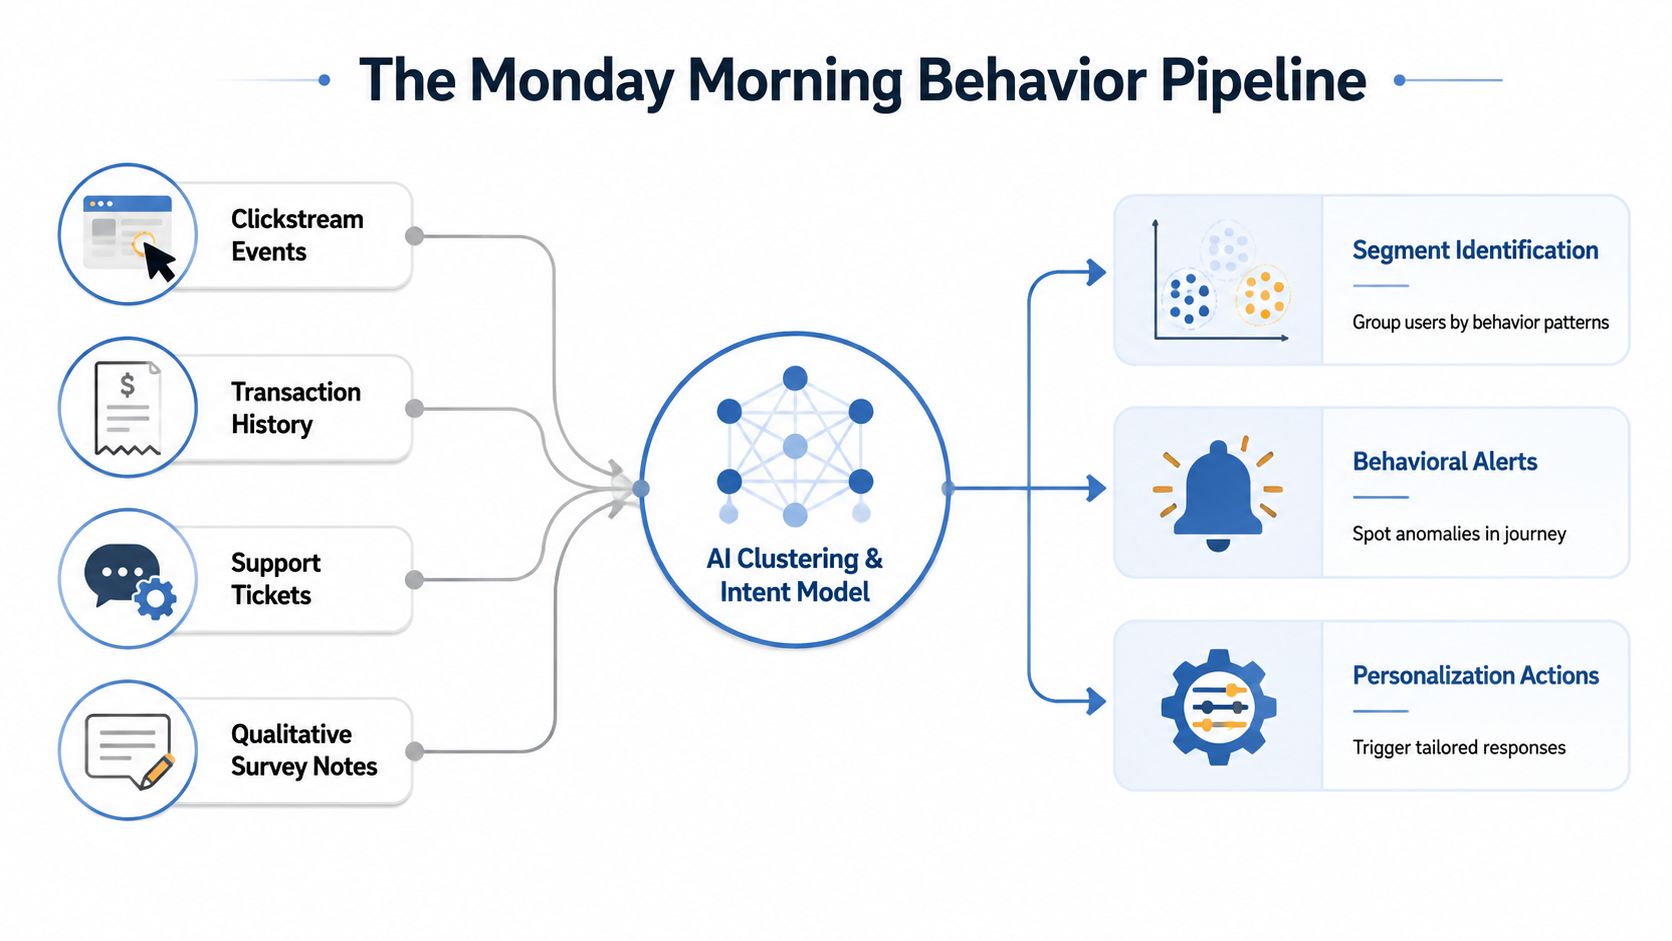
The opportunity exists because an LLM can inspect structured events alongside unstructured customer language in one working session. Two years ago, most small operators needed separate analysis, support review, and campaign work. I can now connect those tasks in a Monday workflow without buying an enterprise platform.
1. Collect four feeds
I pull clickstream events, transactions, support tickets, and one qualitative source such as survey notes or interview transcripts. Every record needs a user identifier where possible, an event timestamp, an event name, and enough context to interpret the action.
I store the data in BigQuery or Snowflake. A smaller operator can begin with a clean export and move into a warehouse when the manual joins become painful. The important choice is consistency, not the logo on the storage layer.
2. Model the behavior table
I use dbt to create models for session depth, page sequence, purchase recency, repeat activity, product transitions, price interactions, support themes, and time between key events. A post-cart-addition study found models reached up to 89% F1, with strong drivers including historical purchase activity, session frequency, pages viewed, price sensitivity, category transitions, and geographical context. (Post-cart-addition behavior study)
That result points to the feature design. Don't send an LLM a pile of raw rows and ask for magic. Give it behavioral features that preserve sequence and recent context.
3. Slice cohorts
I use Hex or a notebook to inspect cohorts before asking the model for a diagnosis. I check whether a pattern is large enough to act on, whether it appears in multiple periods, and whether the event definitions are trustworthy.
4. Retrieve recent context
I give the LLM the last 30 days of events, the cohort definition, the relevant friction log, and selected support or survey excerpts. Retrieval keeps the prompt focused. It also makes the output easier to audit than a request to summarize an entire customer database.
5. Run the diagnosis prompt
I use a structure like this:
You are analyzing customer behavior for a small online business.
Cohort definition: [exact event conditions].
Observation window: [dates].
Event summary: [counts and ordered paths].
Transaction context: [orders, products, values].
Friction log: [timestamped issue, affected path, evidence link].
Qualitative notes: [short excerpts with source links].
Return exactly three friction hypotheses. For each, include the observed path, supporting event IDs or evidence links, the smallest experiment worth shipping, the trigger that starts it, the success metric, and the stop condition. Recommend only actions that can be measured through an event, transaction, or campaign outcome. If evidence is insufficient, say “insufficient evidence” and recommend no action.
The final constraint matters. Without it, the model produces plausible campaign ideas detached from the data.
6. Rank experiments
I rank suggestions by evidence quality, time to ship, expected business value, and reversibility. A checkout email is easier to reverse than a pricing change. A copy test is faster than a product rebuild. The model can sort the list, but I decide what gets shipped.
7. Execute one action
The action may be an abandoned-checkout email, an onboarding nudge, a support intervention, or a reactivation offer. I connect the selected cohort to the CRM or email tool, then record the trigger and comparison group before launch.
8. Paste the action list into Slack
The output should fit in a short operational note:
- Cohort: Who qualifies and who is excluded.
- Evidence: The exact path and friction event.
- Action: What ships, where, and when.
- Metric: The number that determines success.
- Owner: The person doing the work, which may be you.
I wrote a fuller version of this kind of system in my guide to AI agents for customer research.
This replaces scattered spreadsheet work, manual ticket reading, and the weekly meeting where everyone debates what happened. It still needs trustworthy event names and human review. If those inputs are poor, the workflow produces a polished explanation of bad data.
Three Growth Use Cases That Map Behavior to Revenue
I've seen the strongest behavior work start with a narrow trigger rather than a grand customer model. The operator picks one moment where intent is visible, defines the cohort precisely, and gives the model a job it can complete.
Checkout abandonment
The trigger was a 90-second idle on the payment step. The cohort included shoppers who had added a product, reached payment, and then stopped without a purchase. The model paired that idle pattern with prior shipping-cost views and produced a friction hypothesis: the recovery message needed to address delivery cost before repeating the product pitch.
The experiment changed the recovery email. One version repeated the product benefits. The other addressed shipping expectations and returned the shopper to the payment step. Recovery moved from 11% to 17% over six weeks.
Repeat-purchase decay
For a subscription SKU, I overlaid time-to-second-order cohorts with usage telemetry. The trigger was a customer reaching the expected repurchase window without the usage pattern associated with a second order. The model connected the decline to a packaging cue that failed to tell customers when to reorder.
The shipped experiment changed that cue and measured second-order behavior by cohort. Month-two repeat rose by 9 points. The lesson is that a retention problem can originate in product communication, not in the reactivation email.
Onboarding collapse
A B2B SaaS product lost users at step six. The trigger was a completed step five followed by an exit before activation. The model grouped paths by role and found that one permission request appeared at the exact point where a particular role stalled.
The experiment introduced a conditional path. Users who didn't need that permission continued onboarding, while the relevant role saw the request with clearer context. The useful output wasn't a broad “onboarding needs work” summary. It was a role-specific product decision.
Behavior use cases mapped to revenue
| Use Case | Behavioral Trigger | Model Output | Shipped Change | Measured Lift |
|---|---|---|---|---|
| Checkout abandonment | 90-second payment-step idle | Shipping-cost friction hypothesis | Recovery email addressing delivery expectations | Recovery moved from 11% to 17% over six weeks |
| Repeat purchase | Missed second-order window plus usage decay | Packaging cue hypothesis | Changed reorder cue | Month-two repeat rose by 9 points |
| Onboarding drop-off | Exit at step six after step five | Role-based permission friction | Conditional onboarding path | Track step-six completion and activation |
For retention work, I use the same event-first approach described in my guide to AI for customer retention. The model should explain which behavior changed and what action can affect it.
Your Measurement Plan and the Number That Matters
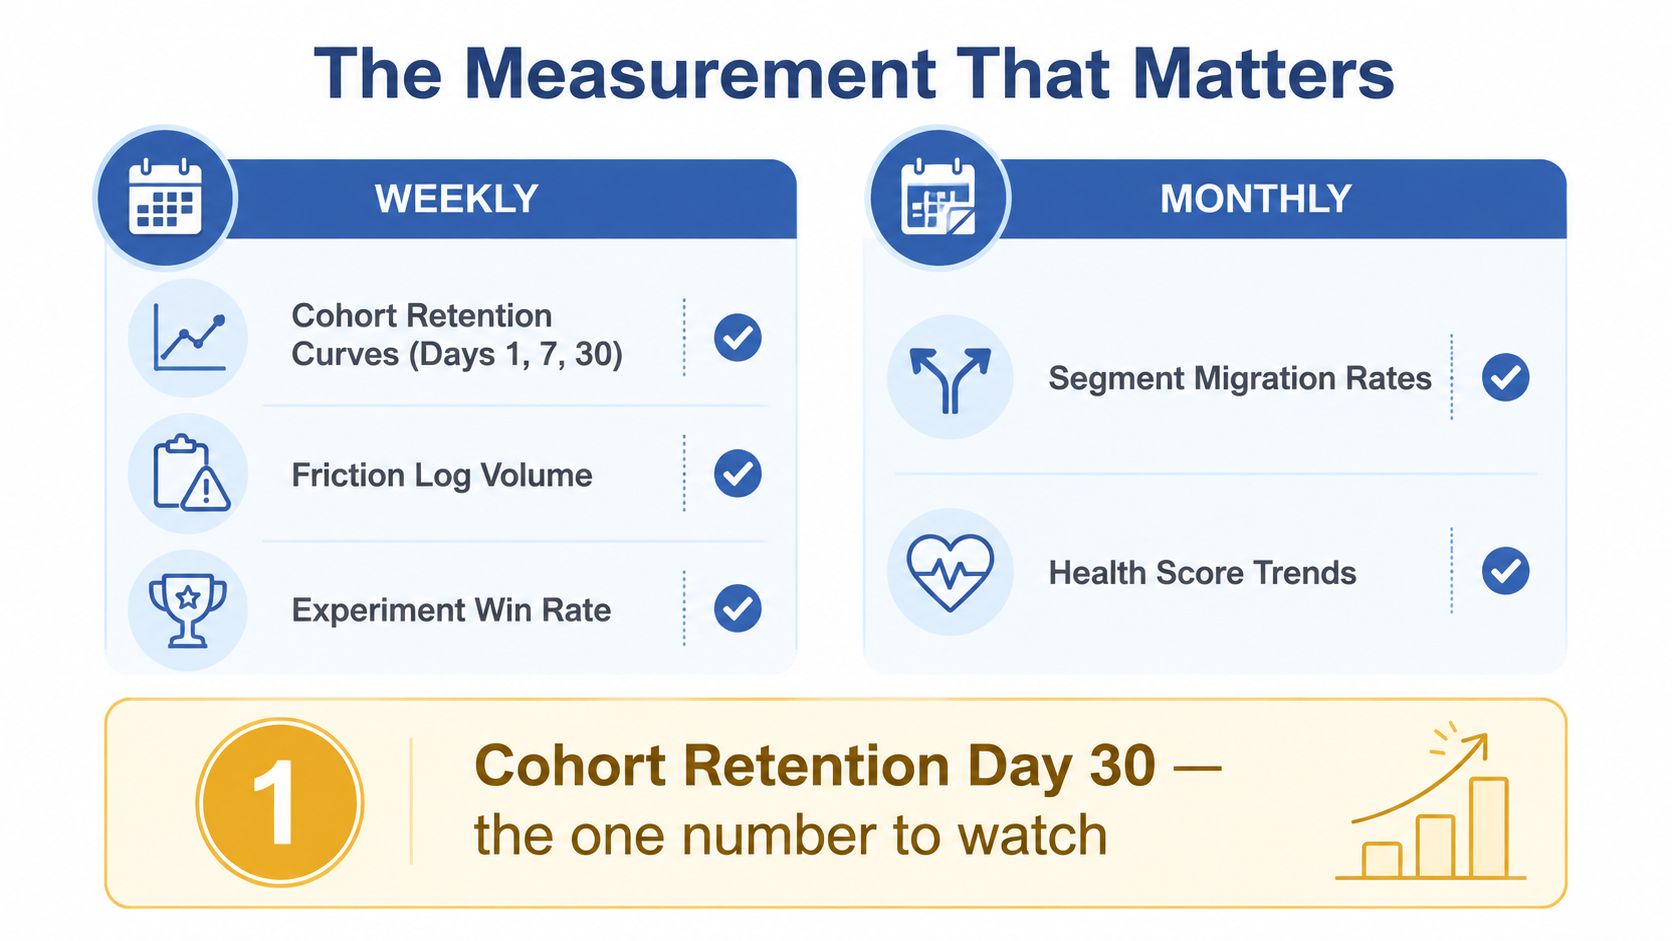
A behavior program needs a review cadence that matches decision speed. I use a small weekly set for operational changes, then reserve unit economics for the monthly view. The dashboard earns its place only when it helps the team choose what to change, rather than confirming that activity exists.
Weekly view
I track:
- Cohort retention curves: Review behavior at days 1, 7, and 30.
- Friction log volume: Count newly recorded issues and group them by journey step.
- Experiment win rate: Record shipped tests and whether each met its predefined success rule.
Weekly metrics expose movement quickly. They do not explain the full economics of a cohort, so I avoid using them to make acquisition or budget decisions on their own.
Monthly view
I review segment migration rates, behavior-adjusted lifetime value, and the share of revenue attributed to behavior-driven campaigns. Migration matters because a customer can move from high intent to hesitation without changing their profile. Behavior-adjusted value matters because two customers with similar revenue today may follow very different paths toward the next purchase.
Reviews need a defined place in the measurement plan. One analysis reports that 66.5% of consumers always check online reviews before purchasing, while 22.6% trust online reviews completely. (Online review statistics and trends) Another summary reports that more than 99% of American consumers read online reviews before a purchase, and reviews influence 93% of purchasing decisions. (Online reviews statistics) Treat review checking as a behavior checkpoint, then connect it to the next action. The star average alone cannot show which path created trust or hesitation.
The number I prioritize is behavior-adjusted CAC payback by cohort. It forces a harder question than aggregate retention: did the acquisition source bring customers who showed the behaviors associated with staying?
Use this one-page template:
| Field | Record |
|---|---|
| Cohort definition | Events, timestamp window, exclusions |
| Acquisition context | Source and campaign |
| Value behavior | Event that indicates progress |
| Friction event | Timestamped action or exit |
| Intervention | Message, product change, or offer |
| Primary metric | Behavior-adjusted CAC payback |
| Guardrail | Margin, refund, complaint, or unsubscribe signal |
| Review date | Date you'll decide whether to keep it |
For the broader process, use this guide to measure marketing effectiveness. NPS can sit in the report, but it should not decide the experiment.
Where This Work Breaks and the Advice You Should Ignore
The most common failure is demographic obsession. Age, location, and job title can provide context, but they don't explain a timestamped decision. A second failure is treating review volume or NPS as behavioral insight. Reviews matter because customers check them, yet a star average doesn't tell you which path created trust or hesitation.
Chat transcripts create another trap. They capture only a portion of the customer experience, so relying on them alone makes the loudest customers look like the whole market. Use support language to generate hypotheses, then verify those hypotheses against clickstream and transaction events.
Common pitfalls versus what actually works
| Pitfall | Conventional Advice | What To Do Instead |
|---|---|---|
| Demographic obsession | Build segments by age or role | Group recent timestamped actions by path |
| Review volume as insight | Increase the number of reviews | Track review checking alongside conversion events |
| Chat-only analysis | Let transcripts represent customer sentiment | Join support themes to product and purchase events |
| Recency bias | Focus on the latest dashboard movement | Compare recent behavior with prior cohort behavior |
| LLM summaries as truth | Ask the model what customers want | Require evidence links and event IDs for every hypothesis |
| Static personas | Build one ideal customer profile | Maintain behavior cohorts that can change weekly |
| Large quarterly surveys | Survey 1,000 users quarterly | Use surveys to generate hypotheses, then test actions |
If a finding can't connect to a specific user action in the last 14 days, I treat it as decoration. That doesn't make older data useless. It means older context shouldn't override current evidence when you're choosing what to ship now.
What to Build This Week
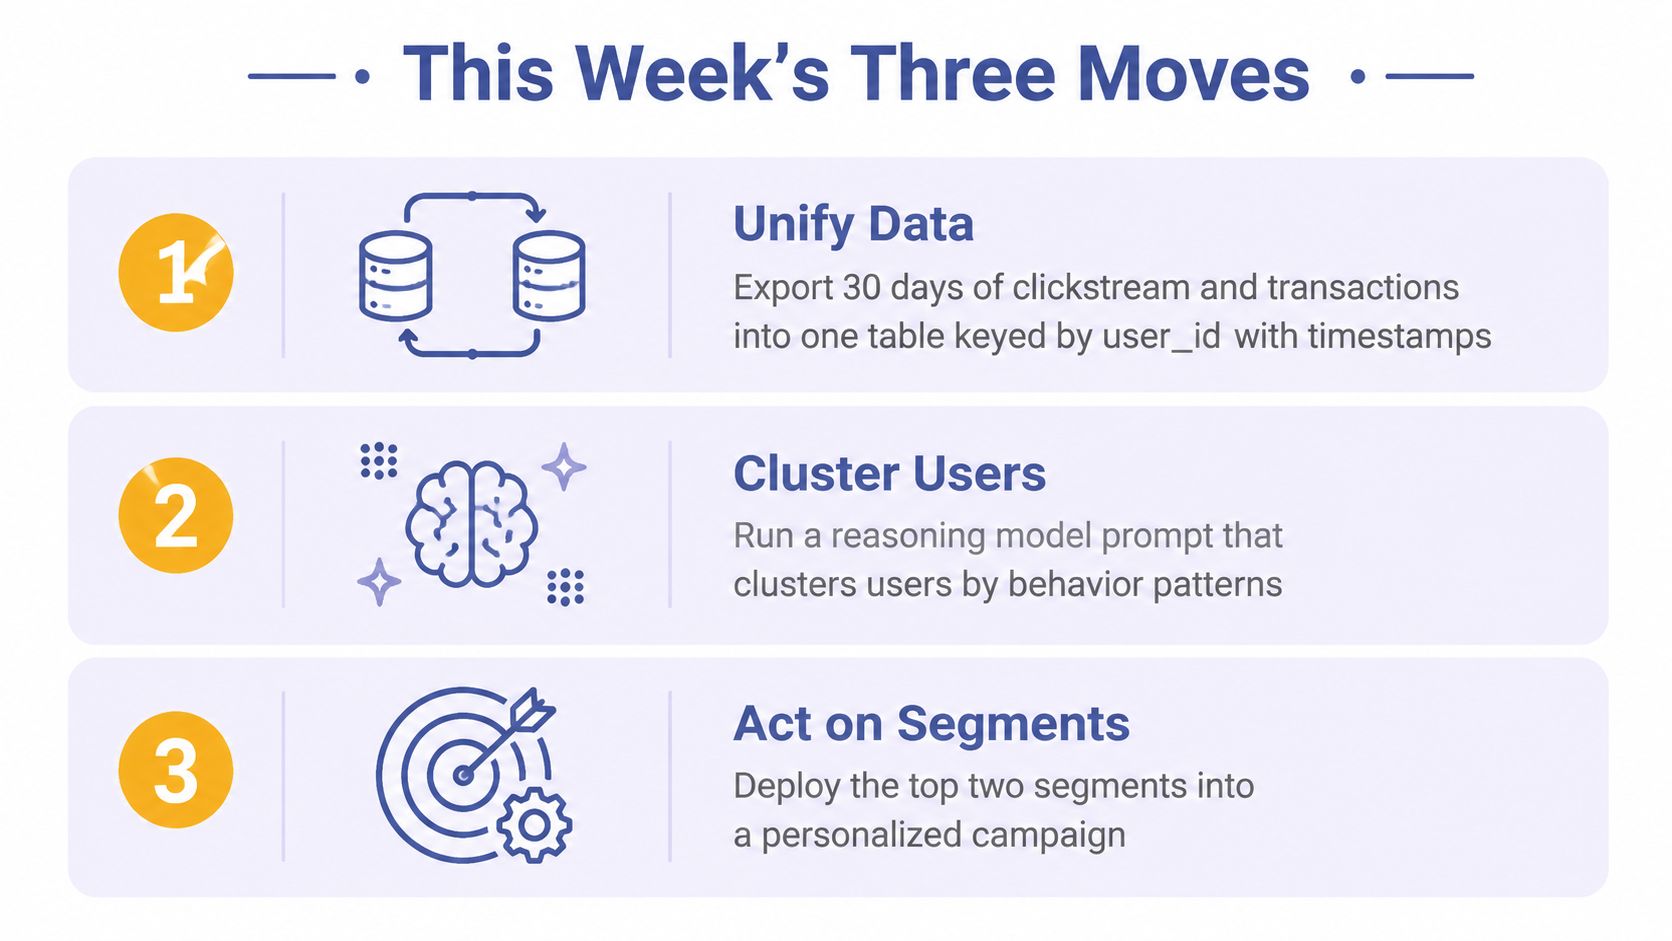
On Monday morning, I'd make three changes.
Unify the data. Export the last 30 days of clickstream events and transactions into one table keyed by
user_id, with timestamps. Add support or survey notes if you can join them without guessing identity.Cluster the paths. Run a reasoning-model prompt that groups users by decision-path shape, not demographics. Ask for the top three friction points, with event evidence and links back to the source records.
Act on one cohort. Create a weekly behavioral view and connect the highest-value cohort to one action, such as a checkout-abandonment email, onboarding nudge, or reactivation offer. Define the success event before sending anything.
That is the bionic system I'd build first. Your data infrastructure supplies the signal, the model supplies a diagnosis, and your CRM executes the response. No new hire is required. You need one reliable table, one constrained prompt, and one behavior-led action you can measure this week.
Bionic Business covers the practical systems I keep testing, including where AI workflows fail and how I repair them. Read the latest field notes from Bionic Business when you want the next workflow to build after this one.
Frequently Asked Questions
What does understanding customer behavior mean for a small online business?
It means your behavior data does three jobs: it maps the decision path, exposes friction, and triggers a timely response. A report that stops at description belongs in research. The useful version connects observed actions, such as a shipping-cost view followed by a cart removal, to a decision you can change this week.
Why are demographic personas weak for understanding customer behavior?
A persona turns a sequence of actions into a label such as value-conscious shopper and loses the reason the purchase happened or failed. If your segment name describes who someone is and says nothing about what they recently did, it probably won’t tell you what to send or change next. Age, location and job title add context, but they don’t explain a timestamped decision.
Which customer behavior framework should I use?
If you still don’t know why people buy, start with Jobs To Be Done interviews layered onto funnel data. If your tracking is reliable and you need weekly experiments, use behavioral cohorts. If you’re scaling tests and need to know whether changes compound, combine Jobs To Be Done, behavioral cohorts and funnel-plus-retention models.
What data do you need to analyze customer behavior with AI?
Pull four feeds: clickstream events, transactions, support tickets, and one qualitative source such as survey notes or interview transcripts. Each record needs a user identifier where possible, a timestamp, an event name and enough context to interpret the action. A smaller operator can start with a clean export of the last 30 days in one table keyed by user ID.
How do you stop an AI model from inventing customer insights?
Give it behavioral features that preserve sequence and recent context instead of a pile of raw rows. Ask for exactly three friction hypotheses, each with the observed path, supporting event IDs or evidence links, the smallest experiment, the trigger, the success metric and the stop condition. Tell it to answer insufficient evidence and recommend no action when the data doesn’t support a claim.
Which metrics show whether customer behavior work is paying off?
Weekly, watch cohort retention at days 1, 7 and 30, friction log volume and experiment win rate. Monthly, review segment migration, behavior-adjusted lifetime value and revenue from behavior-driven campaigns. The number worth prioritizing is behavior-adjusted CAC payback by cohort, because it shows whether an acquisition source brought customers who behave like the ones who stay.