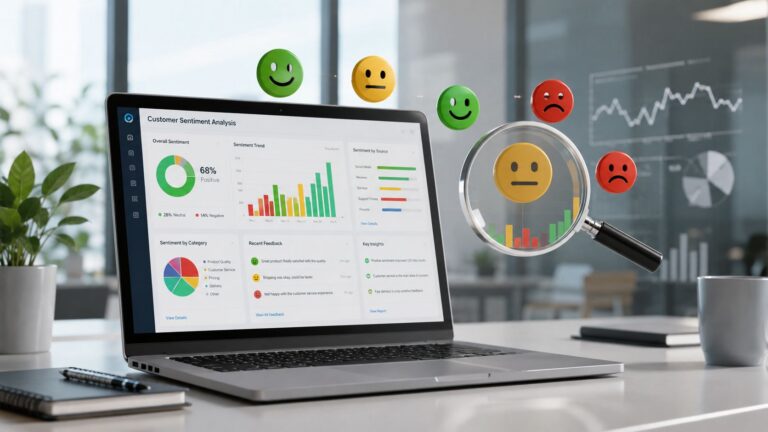
Customer sentiment analysis uses text mining, natural language processing and machine learning to read how customers feel about your product, service or brand in tickets, reviews, surveys and social posts. The label on its own rarely helps. I treat it as useful only once each result is joined to a customer segment, a product theme and a revenue outcome.
You're looking at a healthy average while the customers who matter most are pulling away. Reviews remain positive, survey scores look acceptable, and your dashboard gives you little reason to investigate. Then renewals slow down, support complaints rise, and you discover that one customer segment has been describing the same product problem for weeks.
That's the practical problem behind what is customer sentiment analysis. The hard part isn't assigning positive or negative labels to text. The hard part is connecting customer language to a segment, a product theme, and an outcome you can act on this week.
Table of Contents
- The Moment a Sentiment Score Was Not Enough
- What Customer Sentiment Analysis Actually Is
- Comparing Lexicons, Machine Learning, and LLM Approaches
- The Pipeline I Would Build This Week
- Marketing Use Cases With Real Numbers
- What Most Sentiment Coverage Misses
- Building a Dashboard and What to Do on Monday
The Moment a Sentiment Score Was Not Enough
A founder checks the app store every morning. The rating sits at 4.6 stars, and the latest NPS report shows an average score of 62. The dashboard looks healthy enough to leave alone.
The problem is buried inside the average. New users praise the clean interface, while long-term power users have stopped recommending the product because a core workflow has become slower and less reliable. Their comments are mixed with thousands of lighter opinions, so the overall score barely moves. The founder sees a stable metric. The business is carrying a concentrated retention risk.
That's why I treat sentiment as a workflow input rather than a dashboard decoration. A single score can tell you that something changed. It rarely tells you who noticed it, what caused it, or what revenue outcome is exposed.
I'd connect the feedback to the customer records first. My approach resembles the data-joining logic described in my guide to an AI customer data platform, where raw customer signals become useful only after they're connected to identity and behavior.
Practical rule: Never report sentiment without the customer segment, the theme being discussed, and the business outcome attached to that segment.
The founder should have watched sentiment among long-term paying accounts, separated comments about performance from comments about usability, and compared those groups with renewal behavior. That view might have exposed the issue before the average rating became visibly worse.
The market itself reflects this shift. Polaris Market Research values the global sentiment analytics market at USD 4.68 billion in 2024 and projects USD 17.93 billion by 2034, with a projected 14.40% compound annual growth rate from 2025 to 2034 (Polaris Market Research). The same source also publishes a second estimate: USD 6.44 billion in 2026 and about USD 19.01 billion by 2035. The opportunity for a small business isn't buying an expensive enterprise system. It's using the same basic idea, capture language, classify it, join it to customer context, and act before the average hides the signal.
What Customer Sentiment Analysis Actually Is
Customer sentiment analysis uses text mining, natural language processing, and machine learning to interpret how customers express opinions about a product, service, or brand. IBM describes it as an AI, machine learning, and NLP process that analyzes feedback and reviews in real time, then turns the findings into improvements and impact measurement (IBM).
In practical terms, I'd build four connected layers.
Capture the language customers already produce
Start with support tickets, NPS comments, app store reviews, social posts, chats, and call transcripts. A small business usually has enough material sitting in existing tools. The first job is to export it consistently, preserve the date and channel, and attach an account or customer identifier whenever one exists.
Clean the input before scoring it
Remove duplicated signatures, boilerplate ticket text, tracking links, and irrelevant system messages. Keep negation, product names, feature names, and meaningful punctuation. Cleaning too aggressively can erase the context that separates “not difficult” from “difficult.”
Score sentiment and extract the subject
Document-level polarity assigns one overall label to an entire review or ticket. Sentence-level polarity gives different labels to separate statements. Aspect-based sentiment attaches the opinion to a specific subject, such as onboarding, pricing, reliability, search, or support speed.
Aspect-level analysis is usually more useful for a product decision. “The app is great, but exports fail every time” contains positive brand sentiment and negative reliability sentiment. One overall label loses the distinction that tells you what to fix.
A practical schema might include:
- Polarity: positive, neutral, negative, or mixed.
- Intensity: mild, moderate, or severe.
- Aspect: the feature, service area, or interaction mentioned.
- Intent: complaint, praise, request, comparison, or switching signal.
- Customer context: plan, cohort, source, and account value.
- Evidence: the exact sentence supporting the classification.
The AI-powered brand sentiment monitoring guide is useful background when you're deciding how to monitor feedback across public channels. I'd still keep the system tied to your own customer records, because a public mention without segment context is an observation, not a decision.
Sentiment is therefore a feature in a larger decision system. It can help identify frustration, delight, confusion, advocacy, or switching intent. It can't tell you what to do until you join it to the customer, theme, and outcome.
Comparing Lexicons, Machine Learning, and LLM Approaches
The conventional advice is to start with the most advanced model available. For a small business, that's often wrong. A simple lexicon can be easier to audit, cheaper to run, and perfectly adequate for short, repetitive messages. A transformer or LLM earns its place when context and aspect detail matter.
A comparative study of customer sentiment methods reported RoBERTa at 89% accuracy versus VADER at 71% on retail social data. The same source reports SVM at 78% and Random Forest at 76% on Amazon reviews (IJARCCE study). Those figures don't create a universal winner. They show why the evaluation set must resemble your own customer language.
| Approach | Cost per 1k texts | Setup time | Short-text accuracy | Long or sarcastic text | Best fit |
|---|---|---|---|---|---|
| Lexicon, such as VADER, AFINN, or Bing Liu | Usually low | Fast | Useful for simple, explicit wording | Weak when context changes the meaning | Emoji-heavy reviews, short tags, repetitive feedback |
| Classical or fine-tuned machine learning | Depends on hosting and training | Moderate | Strong when labels match the domain | Better with domain examples | Stable categories and repeated workflows |
| LLM scoring with structured prompts | Usage-based | Fast to start | Strong when the prompt is constrained | Better at mixed intent and multiple aspects | Smaller datasets, exploratory analysis, complex language |
Lexicons still win when the text is short and predictable. A tag such as “late delivery” or a review filled with clear emoji signals doesn't need an expensive reasoning pass. They also make it easier to explain why a label appeared, since the result comes from visible terms and rules.
Fine-tuned models pull ahead when your vocabulary differs from general internet language. Research on customer-feedback classification reports Aspect-BERT at 95.6% accuracy, BERT at 94.1%, and BiLSTM at 90.4% (IRE Journals study). That supports a practical conclusion: if you need feature-level or issue-level decisions, domain adaptation matters more than choosing a fashionable model.
LLMs are helpful for early exploration, especially when you don't yet have a labeled dataset. I'd use a constrained prompt, a fixed taxonomy, and JSON output. I wouldn't let an LLM invent categories on every run, because your trend lines become impossible to compare.
Before choosing a model, I'd also read my guide on which LLM is the best for the task. The relevant question is fit, cost, consistency, and review effort, not a leaderboard position.
The Pipeline I Would Build This Week
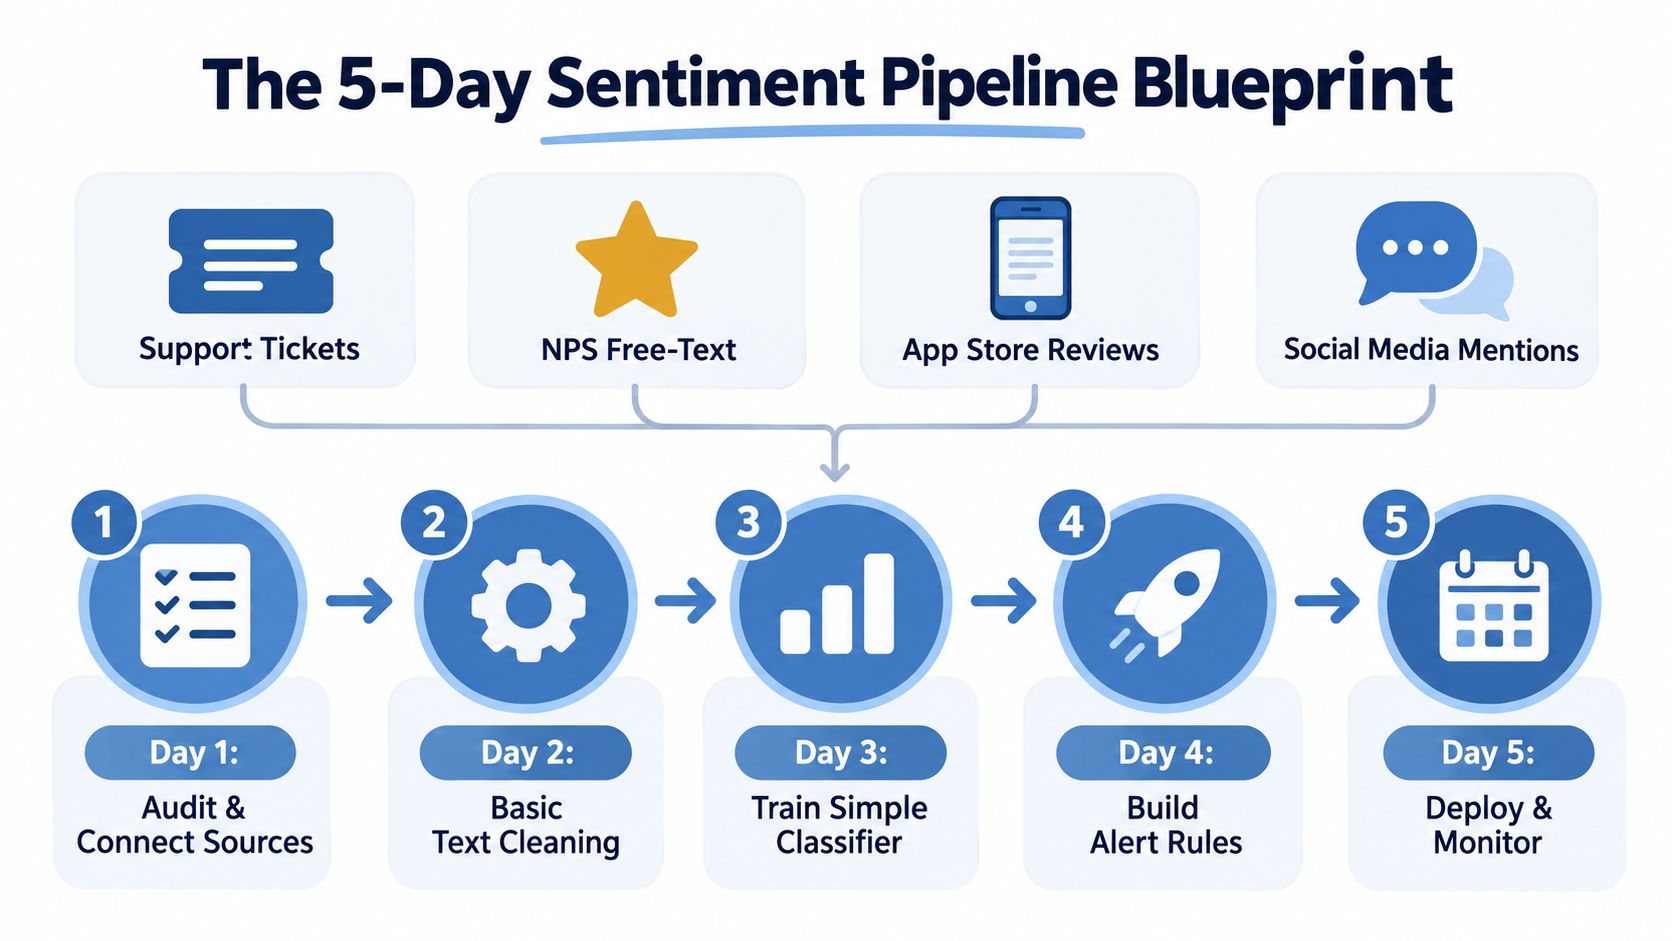
A useful pipeline can run without a data science team. I'd ship a thin version in five working days, then improve the labels after I had real errors to inspect.
Day 1, inventory and connect the sources
I'd begin with four sources:
- Support tickets, because they contain direct problems and urgency.
- NPS free-text, because the score has an explanation attached.
- App store reviews, because customers describe public product friction.
- Social mentions, because they capture perception outside owned channels.
I'd export the text, timestamp, source, customer ID, plan tier, and any available revenue field into one spreadsheet or database table. If identity matching is unreliable, I'd preserve the original source ID instead of pretending the join is accurate.
Day 2, clean the text
I'd remove duplicates and boilerplate, normalize obvious formatting issues, and retain the original text beside the cleaned version. I'd also mark language, channel, and empty responses. Missing context is a data problem, not a modeling problem.
Day 3, choose and test the classifier
If I had no labeled examples, I'd use an LLM with a fixed prompt to classify a small sample. If I had consistent labels, I'd compare a simple classifier with a domain model. I'd switch away from lexicon rules when negation, sarcasm, mixed sentiment, or product terminology created repeated errors.
The prompt should request only fields I can use:
Classify the customer message. Return valid JSON with polarity, intensity, aspect, intent, evidence, and confidence. Use only the approved aspect list. Mark mixed sentiment when the message contains both positive and negative opinions.
Day 4, create alerts and joins
The output table should join each result to customer ID, plan tier, cohort, product area, and revenue. I'd create alerts for repeated negative sentiment around the same aspect within a segment, rather than alerts for every negative sentence.
The full workflow fits beside the broader AI agents for customer research process, especially when an agent helps collect and normalize feedback before classification.
Day 5, deploy and monitor
I'd publish one view and watch sentiment delta per paying account, not the average sentiment score. That number compares the current sentiment signal with the account's earlier signal and keeps the analysis tied to paying customers.
This replaces manual reading of every review and ticket. It doesn't replace judgment. I'd audit misclassified examples each week, revise the taxonomy when a theme becomes too broad, and delay voice-tone analysis or elaborate prediction until the text pipeline produces dependable signal.
Marketing Use Cases With Real Numbers
Marketing teams often ask sentiment analysis to answer a vague question, “How do customers feel?” I'd make the question narrower: which message, feature, or customer concern should change the next campaign?
The first use case is an NPS explainer. The standard workflow asks for a recommendation score from 0 to 10, groups respondents into promoters at 9 to 10, passives at 7 to 8, and detractors at 0 to 6, then calculates NPS by subtracting the percentage of detractors from the percentage of promoters (Amazon Science). I'd classify the open-text explanation by feature, complaint, and intent, then compare the drivers inside each bucket.
A flat score of 42 can become a campaign decision only after the comments show which feature separates promoters from detractors. I'd then test that feature in onboarding emails or customer proof, while measuring qualified activation or renewal behavior. I wouldn't claim that the feature caused the NPS change without a controlled test.
The second use case is product-led acquisition. I'd classify trial feedback around onboarding, pricing, and reliability, then compare those themes with trial-to-paid conversion. If onboarding sentiment weakens while conversion also falls, I'd test clearer setup guidance before changing the entire acquisition message.
The third is launch monitoring. I'd collect public mentions during a launch window, classify emotion and product aspect, then compare the share of voice associated with each emotion against two named rivals. The useful output isn't “the brand feels positive.” It's “buyers praise setup but criticize reliability, while Rival A receives the reverse pattern.” That points to a positioning response and a product question.
| Use case | Data source | Model | Primary metric | Observed result |
|---|---|---|---|---|
| NPS explanation | Survey score and open text | Aspect classifier | NPS delta by driver | Identifies reasons behind promoter and detractor buckets |
| Product feedback loop | Trial comments and product events | Domain classifier or constrained LLM | Trial-to-paid conversion by theme | Shows whether a theme aligns with conversion movement |
| Launch comparison | Social mentions and reviews | Aspect and emotion classifier | Emotion share by brand | Guides messaging and follow-up research |
NPS needs caution. A qualitative study found that the promoter, passive, and detractor buckets don't always map cleanly to expressed sentiment, so I'd use the score as a starting signal and the explanation as the diagnostic layer (NPS qualitative study).
What Most Sentiment Coverage Misses
Most sentiment content stops at classification. Positive, negative, neutral. That's a measurement system, not an operating system.
A score of 6.2 might look acceptable at the company level while a quiet enterprise tier carries a 30-point churn risk. The number is meaningful only after you define how that risk was measured and connect the comments to account outcomes. Without that context, the score invites false confidence.
I'd keep three fields beside every sentiment result:
- Segment: new customer, active account, at-risk account, plan tier, or cohort.
- Theme: pricing, onboarding, reliability, support, integrations, or another approved product area.
- Outcome: renewal, expansion, churn, save attempt, activation, or conversion.
Daily aggregates create another trap. A pricing change can damage sentiment among power users on the day it launches, while a monthly average hides the timing. I'd preserve event dates and compare the affected segment with a relevant baseline.
A sentiment number without a segment, theme, and revenue link is a report ornament.
The signal is also changing shape. Recent industry commentary points to short-form video and AI-generated search responses as customer-expression channels that traditional text systems may miss, while McKinsey research cited in that commentary says consumer sentiment remains weaker than pre-2020 levels and that inflation and rising prices continue to weigh on buyers (I-Genie analysis). For a small business, that doesn't mean buying a multimodal platform this week. It means recording where customers express opinions and labeling the blind spots in your dataset.
The practical rule is simple. Don't ask only, “What is the sentiment?” Ask which customer segment produced it, which theme it names, and which commercial outcome it predicts.
Building a Dashboard and What to Do on Monday
I'd keep the first dashboard narrow enough to use during a Monday review. The primary view should filter sentiment by customer cohort, plan tier, and product area. A secondary panel should show the leading positive and negative themes with directional movement. A revenue panel should place sentiment trends beside expansion, retention, and churn-save results.
A monitoring layer can help turn those changes into routine decisions.
The five numbers I'd review
- Weighted sentiment by segment, with larger paying accounts kept separate from low-context public mentions.
- Theme velocity, the change in volume for each approved theme.
- NPS delta, with the open-text drivers attached.
- Save-rate correlation, comparing negative sentiment patterns with successful retention saves.
- Response coverage, the share of incoming feedback that received a usable classification.
I wouldn't invent a universal alert threshold. Your first week should establish a baseline, then you can define a threshold that reflects normal movement in your own data. If a number moves beyond that baseline, take one of three actions: inspect the underlying comments, contact affected customers, or run a focused product or campaign test.
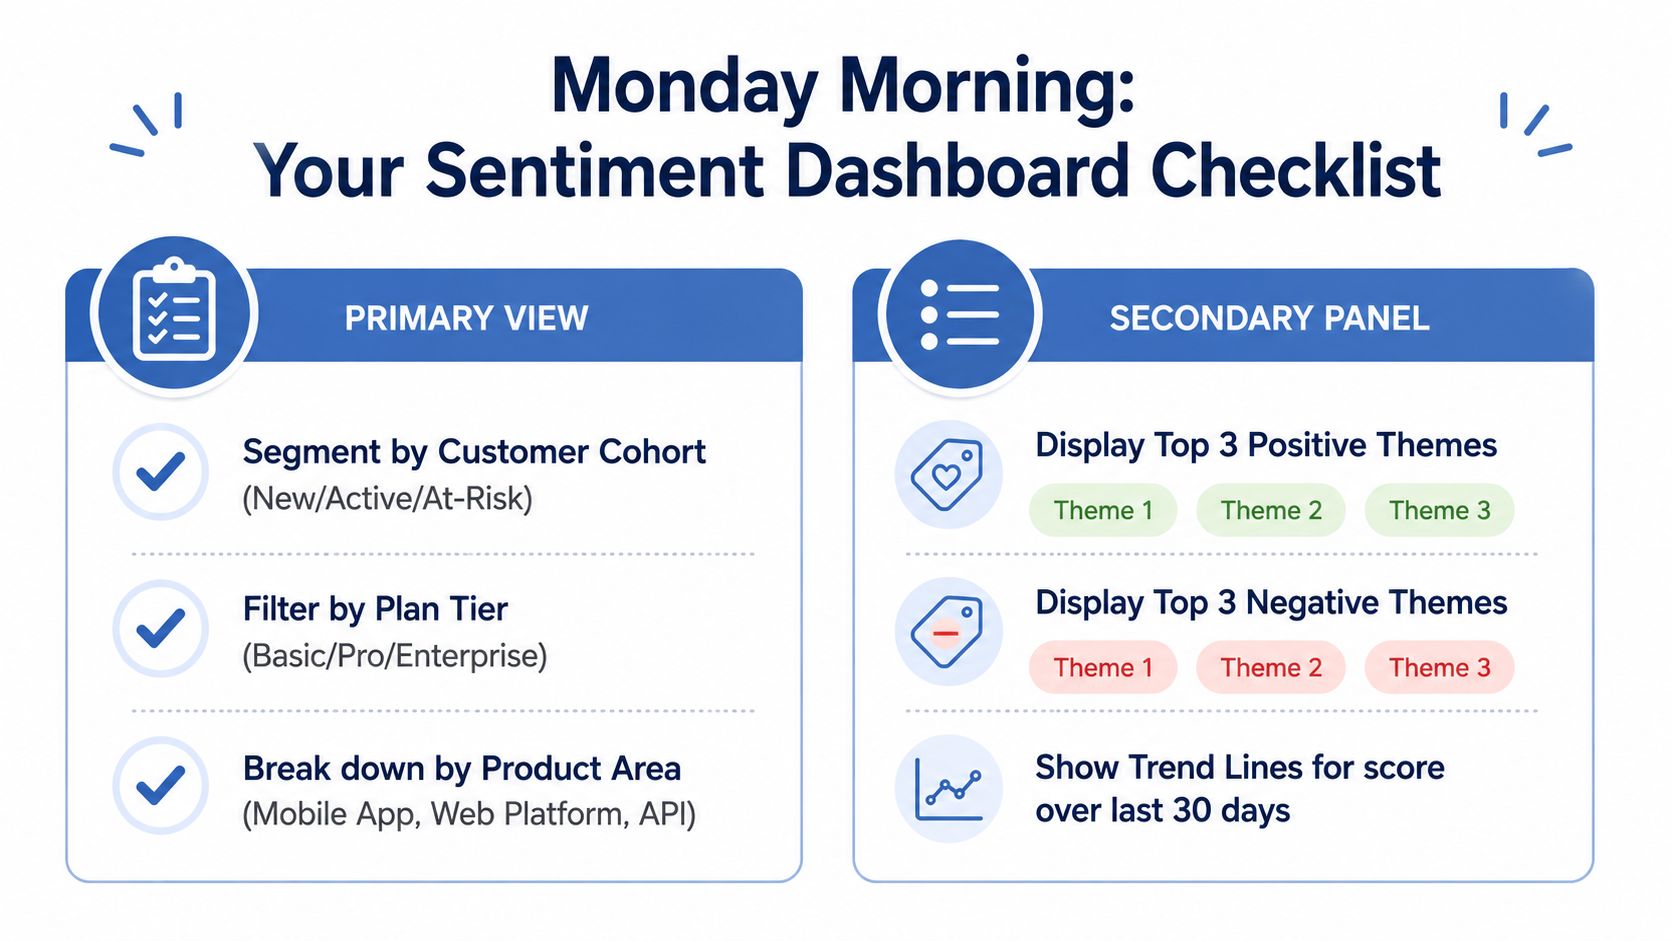
My Monday checklist is short:
- Refresh the data: Confirm the latest tickets, survey comments, reviews, and mentions arrived.
- Audit model accuracy: Read a sample of classifications and correct recurring errors.
- Review the taxonomy: Split themes that have become too broad and remove labels nobody uses.
- Inspect revenue links: Check whether negative themes cluster around renewals, expansion, or saves.
- Run the ritual: Spend 30 minutes turning the largest sentiment deltas into one campaign follow-up or product follow-up.
I'd defer elaborate prediction, voice emotion scoring, and a polished executive dashboard until the basic joins work. The system has worked when a changed sentiment signal produces a specific customer conversation or business test, and when the result is recorded against the number that moved.
On Monday, export your four feedback sources, add customer and plan fields, classify a small sample, and create one report for sentiment delta per paying account. If you want the workflow experiments I continue testing each week, the Bionic Business newsletter follows the same practical path, AI creates the opportunity, and a working system captures it.
Frequently Asked Questions
What is customer sentiment analysis used for?
It turns the language customers already produce in support tickets, NPS comments, app store reviews, social posts, chats and call transcripts into labeled signals. Used well, it shows which segment is unhappy, which product area they mean and which outcome is exposed, such as a renewal or a conversion. That lets you catch a retention problem before a healthy average rating moves.
What is aspect-based sentiment analysis?
Document-level polarity gives a whole review or ticket one label, and sentence-level polarity labels each statement. Aspect-based sentiment attaches the opinion to a specific subject, such as onboarding, pricing, reliability, search or support speed. “The app is great, but exports fail every time” is positive about the brand and negative about reliability, and only aspect-level analysis keeps that distinction.
Should I use a lexicon, a machine learning model or an LLM for sentiment analysis?
Lexicons like VADER are cheap, fast to set up and easy to audit, and they handle short, explicit text well. Fine-tuned models pull ahead when your vocabulary differs from general internet language. An LLM with a constrained prompt, a fixed taxonomy and JSON output suits early exploration when you have no labeled data. Test any option on your own customer language first.
How do I build a customer sentiment analysis pipeline without a data team?
Spread it over five working days. Export support tickets, NPS free text, app store reviews and social mentions with timestamp, source, customer ID and plan tier. Clean out duplicates and boilerplate while keeping negation. Test a classifier on a small sample. Join the results to cohort, product area and revenue, then publish one view that tracks sentiment change per paying account.
What should a customer sentiment dashboard track?
Five numbers: weighted sentiment by segment, theme velocity, NPS delta with its open-text drivers, the correlation between negative sentiment and successful retention saves, and response coverage, meaning the share of feedback that received a usable classification. Filter the main view by cohort, plan tier and product area. Set alert thresholds only after your first week gives you a baseline.
Is NPS the same as customer sentiment?
No. NPS sorts respondents by a 0 to 10 score into promoters, passives and detractors. A qualitative study cited in the article found those buckets don’t always map cleanly to the sentiment people actually express. Treat the score as a starting signal, then classify the open-text explanation by feature, complaint and intent to see what drives each bucket.